Chart2D.area#
- Chart2D.area(x, y1, y2=None, color='b', label='')[source]#
Add an area plot to this chart.
- Parameters:
- xarray_like
X coordinates of the points outlining the area to draw.
- y1array_like
Y coordinates of the points on the first outline of the area to draw.
- y2array_like,
optional Y coordinates of the points on the second outline of the area to draw. Defaults to
np.zeros_like(x).- color
ColorLike, default: “b” Color of the area drawn in this plot. Any color parsable by
pyvista.Coloris allowed.- label
str, default: “” Label of this plot, as shown in the chart’s legend.
- Returns:
plotting.charts.AreaPlotThe created area plot.
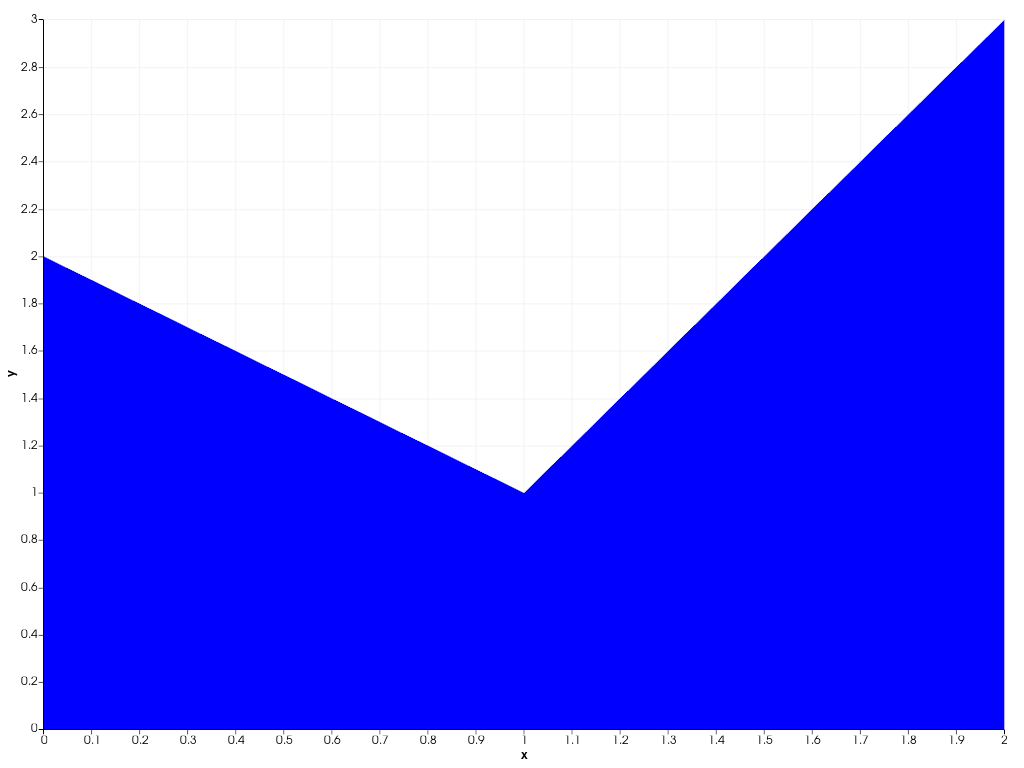
Examples
Generate an area plot.
>>> import pyvista as pv
>>> chart = pv.Chart2D()
>>> plot = chart.area([0, 1, 2], [2, 1, 3])
>>> chart.show()