Plotter.subplot#
- Plotter.subplot(index_row: int, index_column: int | None = None) None[source]#
Set the active subplot.
- Parameters:
Examples
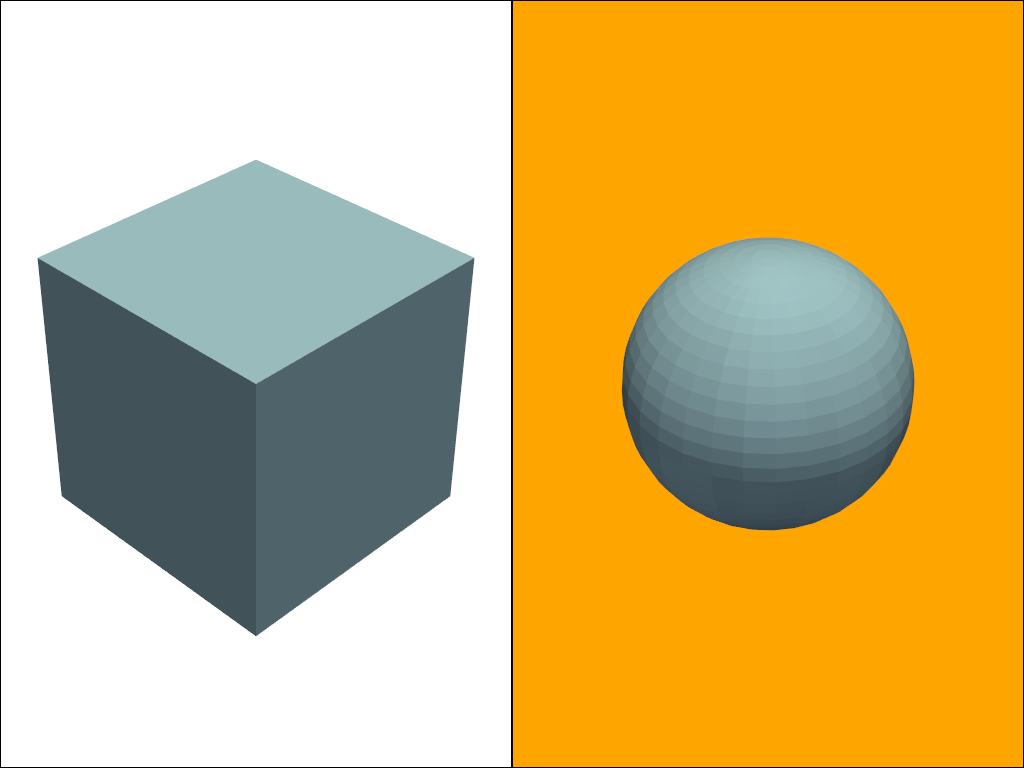
Create a 2 wide plot and set the background of right-hand plot to orange. Add a cube to the left plot and a sphere to the right.
>>> import pyvista as pv
>>> pl = pv.Plotter(shape=(1, 2))
>>> actor = pl.add_mesh(pv.Cube())
>>> pl.subplot(0, 1)
>>> actor = pl.add_mesh(pv.Sphere())
>>> pl.set_background('orange', all_renderers=False)
>>> pl.show()