Plotter.show_grid#
- Plotter.show_grid(**kwargs)[source]#
Show grid lines and bounds axes labels.
A wrapped implementation of
show_bounds()to change default behavior to use grid lines and showing the axes labels on the outer edges.This is intended to be similar to
matplotlib.pyplot.grid().- Parameters:
- **kwargs
dict,optional See
Renderer.show_bounds()for additional keyword arguments.
- **kwargs
- Returns:
pyvista.CubeAxesActorBounds actor.
See also
show_boundsremove_bounds_axesupdate_bounds_axes- Axes Objects
Example showing different axes objects.
- Plotting Bounds
Additional examples using this method.
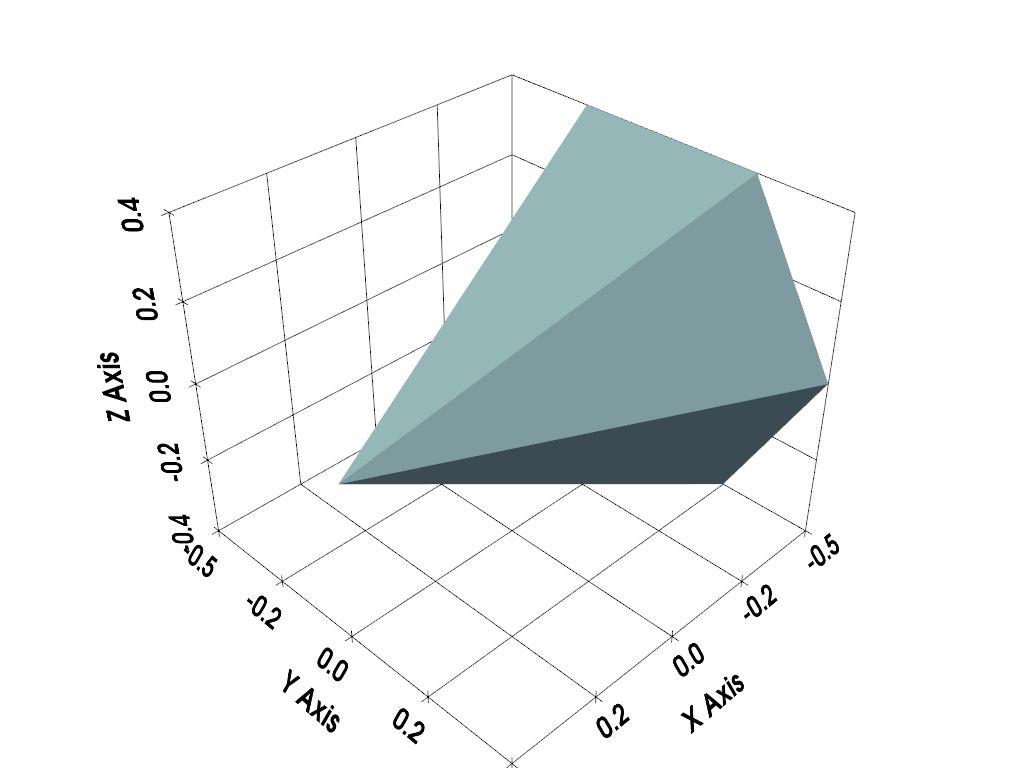
Examples
>>> import pyvista as pv
>>> mesh = pv.Cone()
>>> pl = pv.Plotter()
>>> _ = pl.add_mesh(mesh)
>>> _ = pl.show_grid()
>>> pl.show()