
Plotter.remove_chart#
Examples#
Download Python source code | Download Jupyter notebook
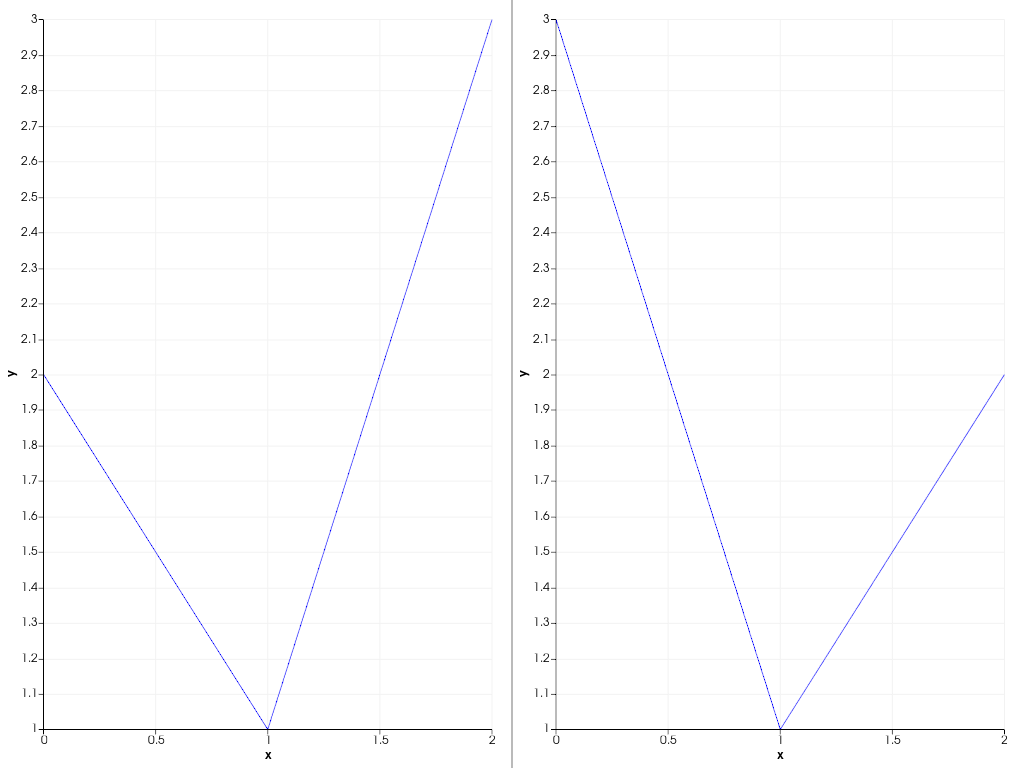
First define a function to add two charts to a renderer.
>>> import pyvista as pv
>>> def plotter_with_charts():
...     pl = pv.Plotter()
...     pl.background_color = 'w'
...     chart_left = pv.Chart2D(size=(0.5, 1))
...     _ = chart_left.line([0, 1, 2], [2, 1, 3])
...     pl.add_chart(chart_left)
...     chart_right = pv.Chart2D(size=(0.5, 1), loc=(0.5, 0))
...     _ = chart_right.line([0, 1, 2], [3, 1, 2])
...     pl.add_chart(chart_right)
...     return pl, chart_left, chart_right
>>> pl, *_ = plotter_with_charts()
>>> pl.show()
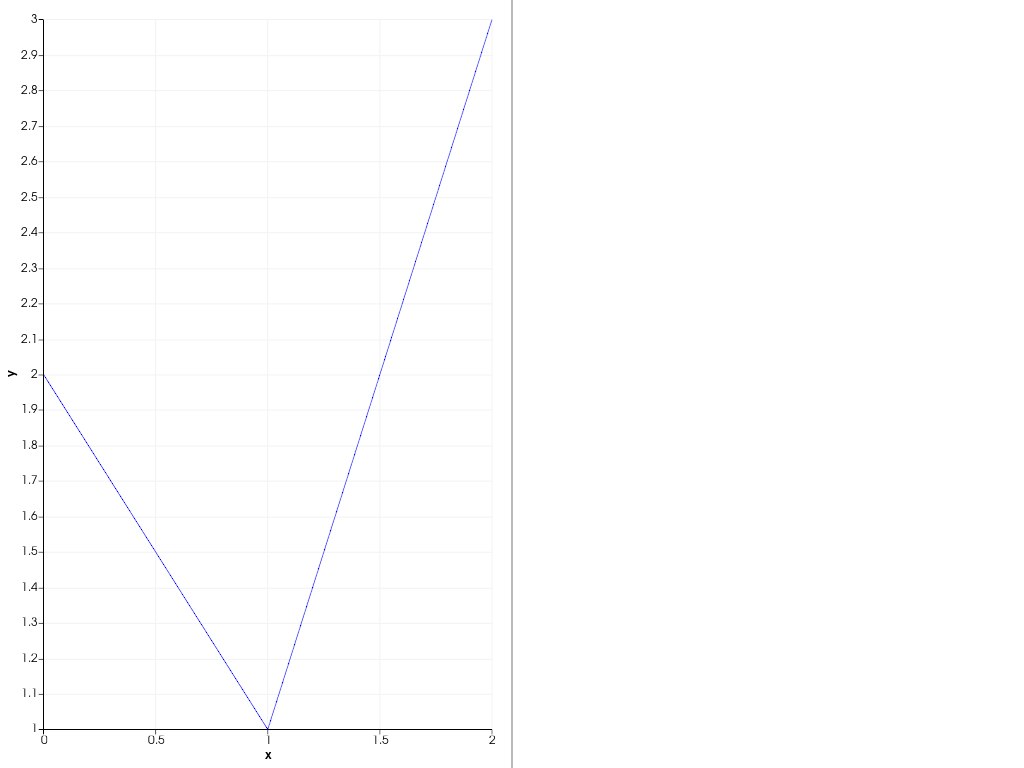
Now reconstruct the same plotter but remove the right chart by index.
>>> pl, *_ = plotter_with_charts()
>>> pl.remove_chart(1)
>>> pl.show()
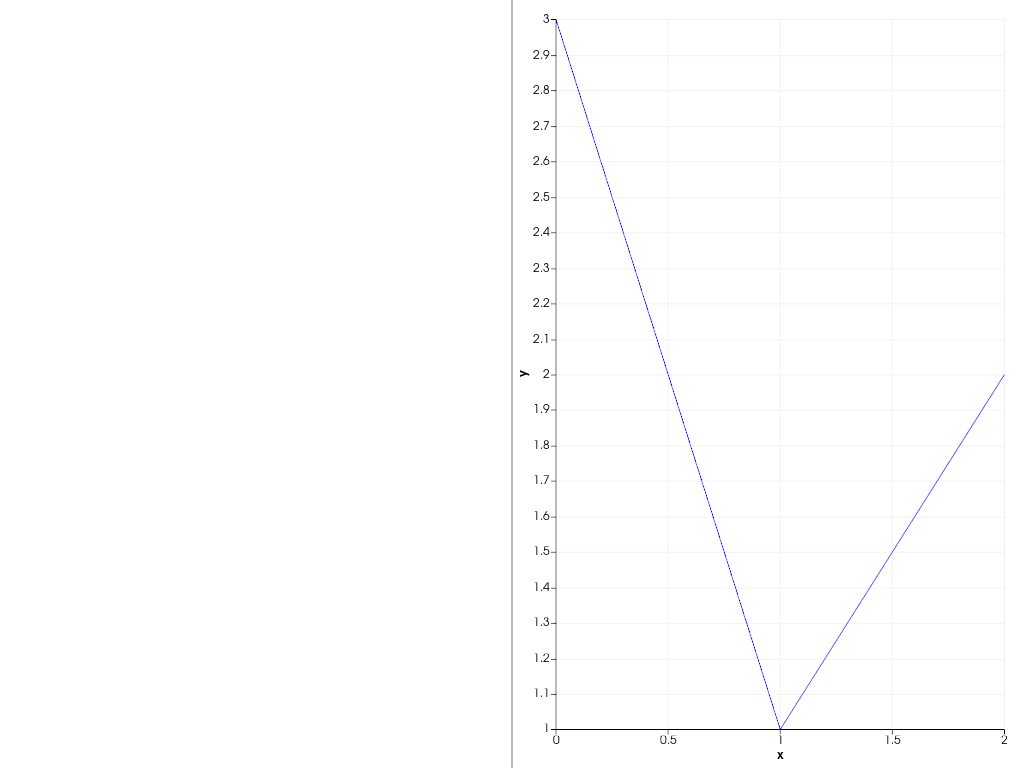
Finally, remove the left chart by reference.
>>> pl, chart_left, chart_right = plotter_with_charts()
>>> pl.remove_chart(chart_left)
>>> pl.show()
Used In#
API Examples
Renderer.remove_chart(1 use)
