Plotter.add_scalar_bar#
- Plotter.add_scalar_bar(
- title='',
- mapper=None,
- n_labels=5,
- italic: bool = False,
- bold: bool = False,
- title_font_size=None,
- label_font_size=None,
- color=None,
- font_family=None,
- shadow: bool = False,
- width=None,
- height=None,
- position_x=None,
- position_y=None,
- vertical=None,
- interactive=None,
- fmt=None,
- use_opacity: bool = True,
- outline: bool = False,
- nan_annotation: bool = False,
- below_label=None,
- above_label=None,
- background_color=None,
- n_colors=None,
- fill: bool = False,
- render: bool = False,
- theme=None,
- unconstrained_font_size: bool = False,
- unique_bar: bool = False,
Create scalar bar using the ranges as set by the last input mesh.
- Parameters:
- title
str, default: “” Title of the scalar bar. Default is rendered as an empty title.
- mappervtkMapper,
optional Mapper used for the scalar bar. Defaults to the last mapper created by the plotter.
- n_labels
int, default: 5 Number of labels to use for the scalar bar.
- italicbool, default:
False Italicises title and bar labels.
- boldbool, default:
False Bolds title and bar labels.
- title_font_size
float,optional Sets the size of the title font. Defaults to
Noneand is sized according topyvista.plotting.themes.Theme.font.- label_font_size
float,optional Sets the size of the title font. Defaults to
Noneand is sized according topyvista.plotting.themes.Theme.font.- color
ColorLike,optional Either a string, rgb list, or hex color string. Default set by
pyvista.plotting.themes.Theme.font. Can be in one of the following formats:color='white'color='w'color=[1.0, 1.0, 1.0]color='#FFFFFF'
- font_family{‘courier’, ‘times’, ‘arial’}
Font family. Default is set by
pyvista.plotting.themes.Theme.font.- shadowbool, default:
False Adds a black shadow to the text.
- width
float,optional The percentage (0 to 1) width of the window for the colorbar. Default set by
pyvista.plotting.themes.Theme.colorbar_verticalorpyvista.plotting.themes.Theme.colorbar_horizontaldepending on the value ofvertical.- height
float,optional The percentage (0 to 1) height of the window for the colorbar. Default set by
pyvista.plotting.themes.Theme.colorbar_verticalorpyvista.plotting.themes.Theme.colorbar_horizontaldepending on the value ofvertical.- position_x
float,optional The percentage (0 to 1) along the windows’s horizontal direction to place the bottom left corner of the colorbar. Default set by
pyvista.plotting.themes.Theme.colorbar_verticalorpyvista.plotting.themes.Theme.colorbar_horizontaldepending on the value ofvertical.- position_y
float,optional The percentage (0 to 1) along the windows’s vertical direction to place the bottom left corner of the colorbar. Default set by
pyvista.plotting.themes.Theme.colorbar_verticalorpyvista.plotting.themes.Theme.colorbar_horizontaldepending on the value ofvertical.- verticalbool,
optional Use vertical or horizontal scalar bar. Default set by
pyvista.plotting.themes.Theme.colorbar_orientation.- interactivebool,
optional Use a widget to control the size and location of the scalar bar. Default set by
pyvista.plotting.themes.Theme.interactive.- fmt
str,optional printfformat for labels. Default set bypyvista.plotting.themes.Theme.font.- use_opacitybool, default:
True Optionally display the opacity mapping on the scalar bar.
- outlinebool, default:
False Optionally outline the scalar bar to make opacity mappings more obvious.
- nan_annotationbool, default:
False Annotate the NaN color.
- below_label
str,optional String annotation for values below the scalars range.
- above_label
str,optional String annotation for values above the scalars range.
- background_color
ColorLike,optional The color used for the background in RGB format.
- n_colors
int,optional The maximum number of color displayed in the scalar bar.
- fillbool, default:
False Draw a filled box behind the scalar bar with the
background_color.- renderbool, default:
False Force a render when True.
- theme
pyvista.plotting.themes.Theme,optional Plot-specific theme. By default, calling from the
Plotter, will use the plotter theme. Setting toNonewill use the global theme.- unconstrained_font_sizebool, default:
False Whether the font size of title and labels is unconstrained. When it is constrained, the size of the scalar bar will constrain the font size. When it is not, the size of the font will always be respected. Using custom labels will force this to be
True.Added in version 0.44.0.
- unique_barbool, default:
False Whether to create a scalar bar which is unique to the subplot. If
True, the scalar bar will be created with a unique key which is not shared with other subplots, even if the input title is the same.Note
Scalar bars are managed by a dictionary with the title as the key. By default, if a scalar bar with the same title already exists, the scalar bar will be shared. If
unique_barisTrue, the scalar bar will be created with a unique key which is the title suffixed with_UNIQUE_ID_{active_renderer_index}, whereactive_renderer_indexis the index of the active renderer in the plotter. This allows for multiple scalar bars with the same title to be created across different subplots.Added in version 0.48.0.
- title
- Returns:
- vtkScalarBarActor
Scalar bar actor.
See also
Notes
Setting
title_font_size, orlabel_font_sizedisables automatic font sizing for both the title and label.Examples
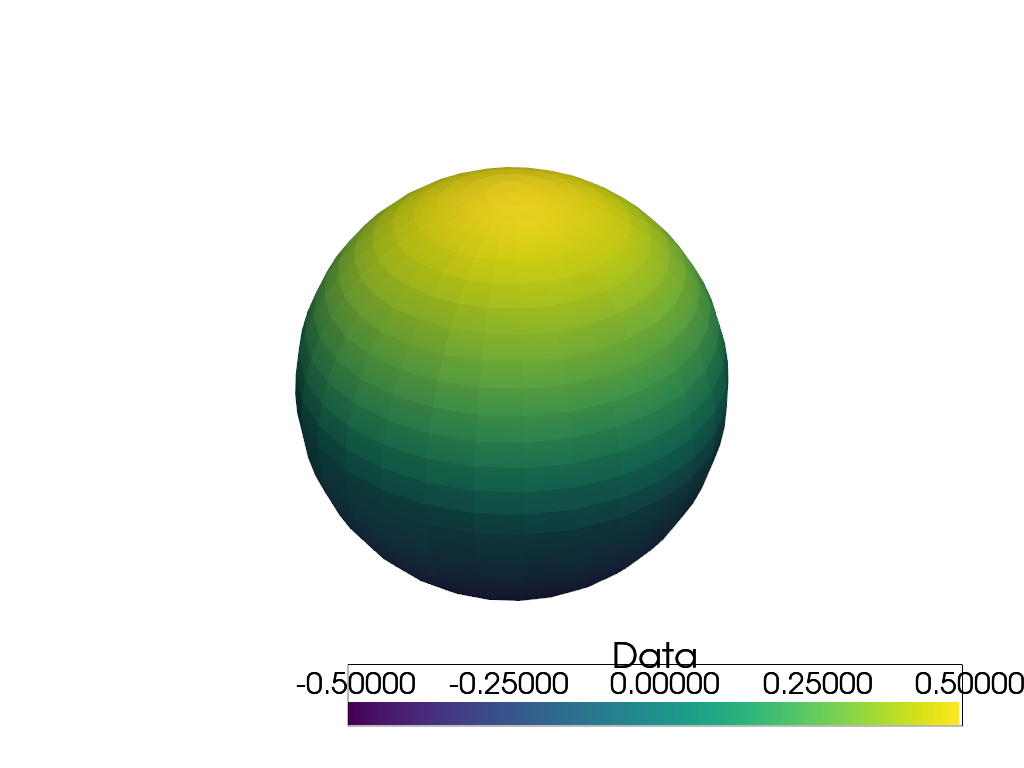
Add a custom interactive scalar bar that is horizontal, has an outline, and has a custom formatting.
>>> import pyvista as pv
>>> sphere = pv.Sphere()
>>> sphere['Data'] = sphere.points[:, 2]
>>> pl = pv.Plotter()
>>> _ = pl.add_mesh(sphere, show_scalar_bar=False)
>>> _ = pl.add_scalar_bar(
...     'Data',
...     interactive=True,
...     vertical=False,
...     title_font_size=35,
...     label_font_size=30,
...     outline=True,
...     fmt='%10.5f',
... )
>>> pl.show()