Plotter.add_point_scalar_labels#
- Plotter.add_point_scalar_labels(
- points: MatrixLikeFloat | VectorLikeFloat | DataSet,
- labels: list[str | int] | str,
- *,
- fmt: str | None = None,
- preamble: str = '',
- **kwargs,
Label the points from a dataset with the values of their scalars.
Wrapper for
pyvista.Plotter.add_point_labels().- Parameters:
- points
MatrixLikeFloat|VectorLikeFloat|DataSet An
n x 3numpy.ndarrayor PyVista dataset with points.- labels
list|str List of scalars of labels. Must be the same length as points. If a string name is given with a
pyvista.DataSetinput for points, then these are fetched.- fmt
str, optional String formatter used to format numerical data.
- preamble
str, default: “” Text before the start of each label.
- **kwargs
dict, optional Keyword arguments passed to
pyvista.Plotter.add_point_labels().
- points
- Returns:
- vtkActor2D
VTK label actor. Can be used to change properties of the labels.
Examples#
Download Python source code | Download Jupyter notebook
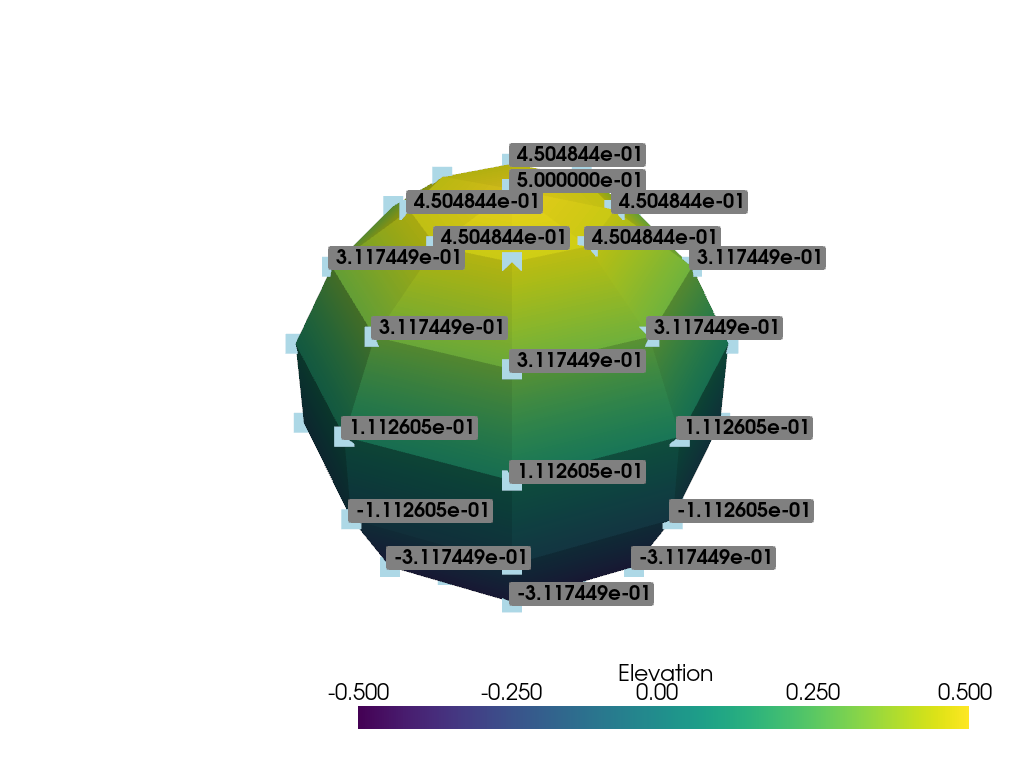
Label points with their elevation.
>>> import pyvista as pv
>>> mesh = pv.Sphere(theta_resolution=8, phi_resolution=8)
>>> mesh['Elevation'] = mesh.points[:, 2]
>>> pl = pv.Plotter()
>>> _ = pl.add_mesh(mesh, scalars='Elevation')
>>> _ = pl.add_point_scalar_labels(
...     mesh,
...     'Elevation',
...     point_size=20,
...     font_size=20,
... )
>>> pl.show()
Used In#
Gallery Examples