Plotter.add_lines#
- Plotter.add_lines(
- lines: NumpyArray[float],
- color: ColorLike = 'w',
- width: float = 5,
- label: str | None = None,
- name: str | None = None,
- connected: bool = False,
Add lines to the plotting object.
- Parameters:
- lines
np.ndarray Points representing line segments. For example, two line segments would be represented as
np.array([[0, 1, 0], [1, 0, 0], [1, 1, 0], [2, 0, 0]]).- color
ColorLike, default: ‘w’ Either a string, rgb list, or hex color string. For example:
color='white'color='w'color=[1.0, 1.0, 1.0]color='#FFFFFF'
- width
float, default: 5 Thickness of lines.
- label
str, default:None String label to use when adding a legend to the scene with
pyvista.Plotter.add_legend().- name
str, default:None The name for the added actor so that it can be easily updated. If an actor of this name already exists in the rendering window, it will be replaced by the new actor.
- connectedbool, default:
False Treat
linesas points representing a series of connected lines. For example, two connected line segments would be represented asnp.array([[0, 0, 0], [1, 0, 0], [1, 1, 0]]). IfFalse, an even number of points must be passed tolines, and the lines need not be connected.
- lines
- Returns:
pyvista.ActorLines actor.
Examples
Plot two lines.
>>> import numpy as np
>>> import pyvista as pv
>>> pl = pv.Plotter()
>>> points = np.array([[0, 1, 0], [1, 0, 0], [1, 1, 0], [2, 0, 0]])
>>> actor = pl.add_lines(points, color='purple', width=3)
>>> pl.camera_position = 'xy'
>>> pl.show()

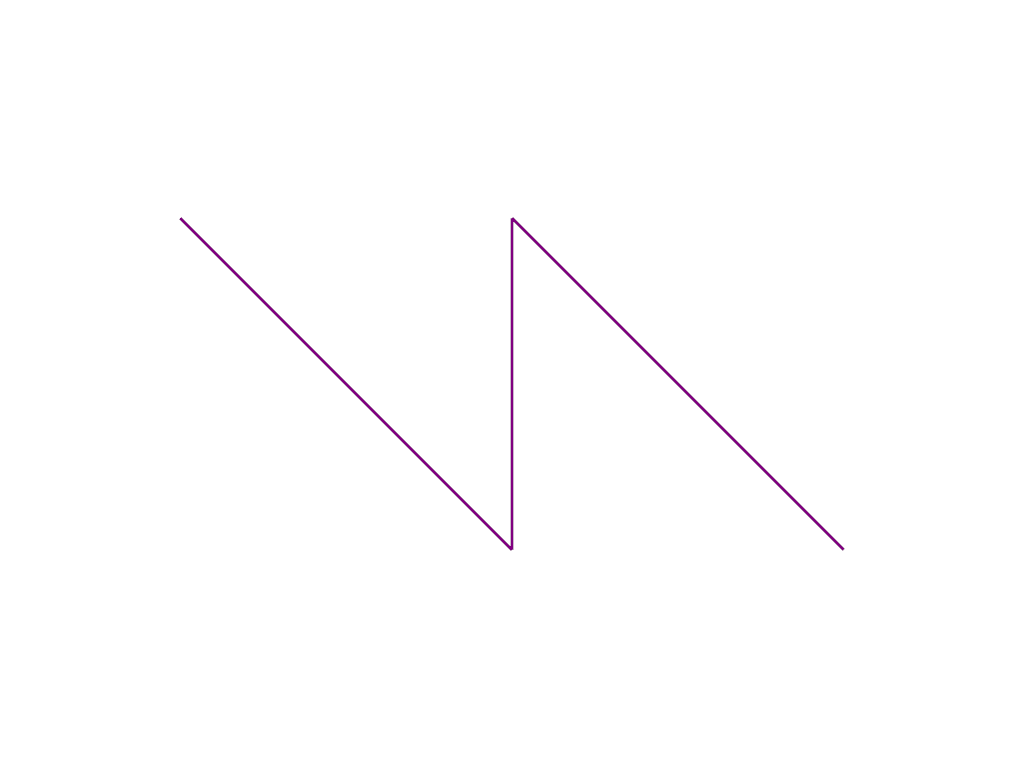
Adding lines with
connected=Truewill add a series of connected line segments.>>> pl = pv.Plotter() >>> points = np.array([[0, 1, 0], [1, 0, 0], [1, 1, 0], [2, 0, 0]]) >>> actor = pl.add_lines(points, color='purple', width=3, connected=True) >>> pl.camera_position = 'xy' >>> pl.show()