LookupTable.ramp#
- property LookupTable.ramp: str[source]#
Set the shape of the table ramp.
This attribute is only used when creating custom color maps and will return
Nonewhen a color map has been set withLookupTable.cmap. This will clear any existing color map and create new values for the lookup table when set.This value may be either
"s-curve","linear", or"sqrt".The default is S-curve, which tails off gradually at either end.
The equation used for
"s-curve"isy = (sin((x - 1/2)*pi) + 1)/2, For an S-curve greyscale ramp, you should setpyvista.LookupTable.n_valuesto 402 (which is256*pi/2) to provide room for the tails of the ramp.The equation for the
"linear"is simplyy = x.The equation for the
"sqrt"isy = sqrt(x).
Examples
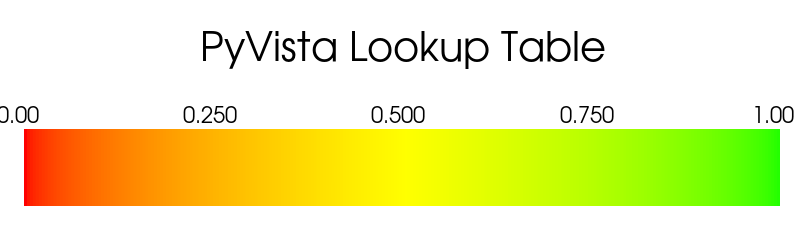
Show the default s-curve ramp.
>>> import pyvista as pv
>>> lut = pv.LookupTable()
>>> lut.hue_range = (0.0, 0.33)
>>> lut.ramp = 's-curve'
>>> lut.plot()
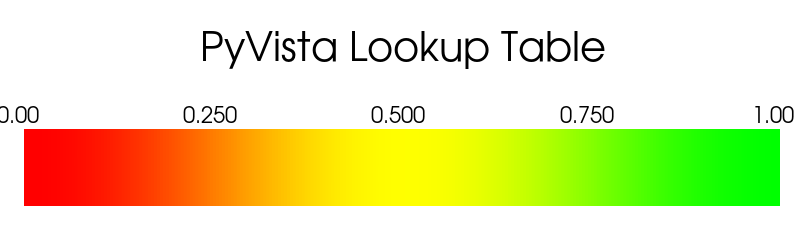
Plot the linear ramp.
>>> import pyvista as pv
>>> lut = pv.LookupTable()
>>> lut.hue_range = (0.0, 0.33)
>>> lut.ramp = 'linear'
>>> lut.plot()
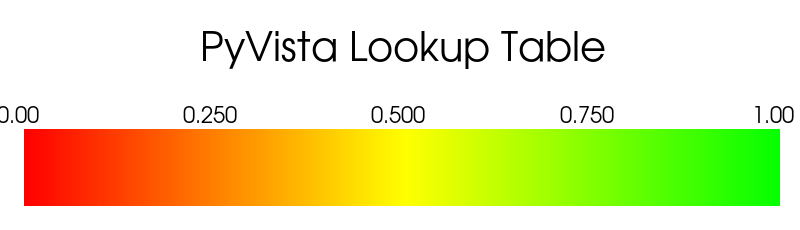
Plot the
"sqrt"ramp.>>> import pyvista as pv >>> lut = pv.LookupTable() >>> lut.hue_range = (0.0, 0.33) >>> lut.ramp = 'sqrt' >>> lut.plot()