LookupTable.apply_cmap#
- LookupTable.apply_cmap( ) None[source]#
Assign a colormap to this lookup table.
This can be used instead of
LookupTable.cmapwhen you need to set the number of values at the same time as the color map.
Examples#
Download Python source code | Download Jupyter notebook
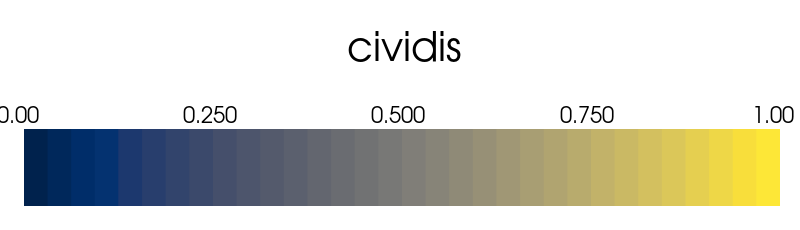
Apply matplotlib’s 'cividis' color map.
>>> import pyvista as pv
>>> lut = pv.LookupTable()
>>> lut.apply_cmap('cividis', n_values=32)
>>> lut.plot()