pyvista.CubeAxesActor#
- class CubeAxesActor(*args, **kwargs)[source]#
Wrap vtkCubeAxesActor.
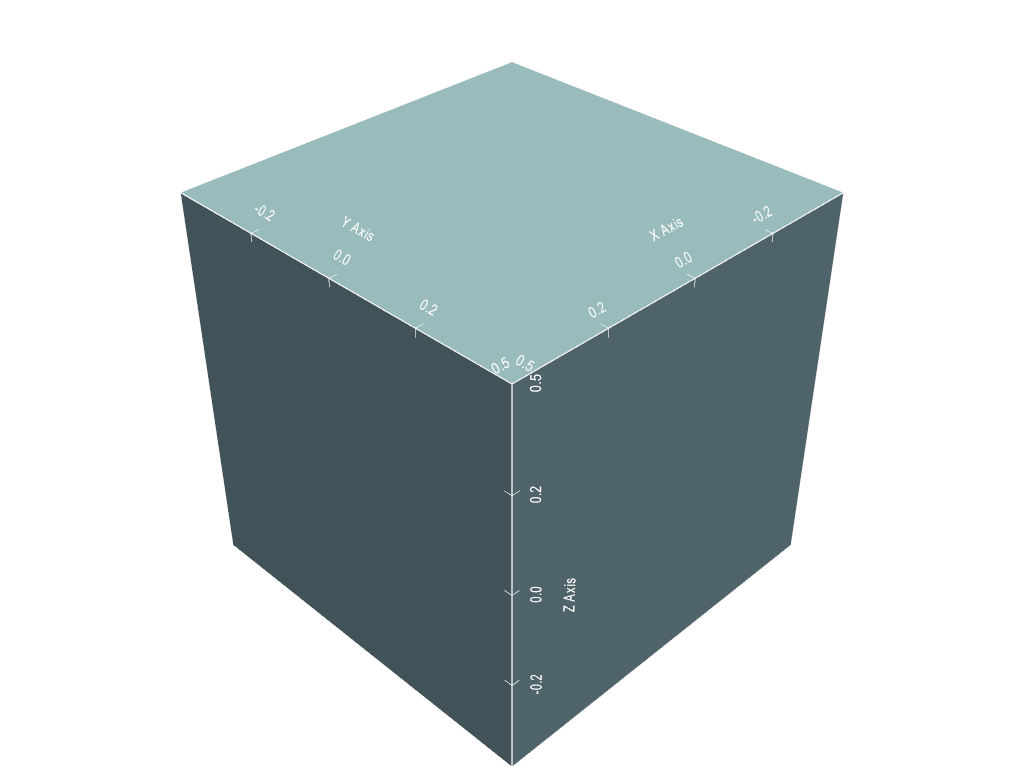
This class is created to wrap vtkCubeAxesActor, which is used to draw axes and labels for the input data bounds. This wrapping aims to provide a user-friendly interface to use vtkCubeAxesActor.
- Parameters:
- camera
pyvista.Camera Camera to link to the axes actor.
- minor_ticksbool, default:
False If
True, also plot minor ticks on all axes.- tick_location
str,optional Set how the ticks are drawn on the axes grid. Options include:
'inside', 'outside', 'both'.- x_title
str, default: “X Axis” Title of the x-axis.
- y_title
str, default: “Y Axis” Title of the y-axis.
- z_title
str, default: “Z Axis” Title of the z-axis.
- x_axis_visibilitybool, default:
True Visibility of the x-axis.
- y_axis_visibilitybool, default:
True Visibility of the y-axis.
- z_axis_visibilitybool, default:
True Visibility of the z-axis.
- x_label_format
str,optional A format string defining how tick labels are generated from tick positions for the x-axis. Defaults to the theme format if set, otherwise
'{0:.1f}'.- y_label_format
str,optional A format string defining how tick labels are generated from tick positions for the y-axis. Defaults to the theme format if set, otherwise
'{0:.1f}'.- z_label_format
str,optional A format string defining how tick labels are generated from tick positions for the z-axis. Defaults to the theme format if set, otherwise
'{0:.1f}'.- x_label_visibilitybool, default:
True The visibility of the x-axis labels.
- y_label_visibilitybool, default:
True The visibility of the y-axis labels.
- z_label_visibilitybool, default:
True The visibility of the z-axis labels.
- n_xlabels
int, default: 5 Number of labels along the x-axis.
- n_ylabels
int, default: 5 Number of labels along the y-axis.
- n_zlabels
int, default: 5 Number of labels along the z-axis.
- camera
See also
show_bounds()show_grid()- Axes Objects
Example showing different axes objects.
Examples
Create a 3D plotter and add a CubeAxesActor to it.
>>> import pyvista as pv
>>> mesh = pv.Cube()
>>> pl = pv.Plotter()
>>> actor = pl.add_mesh(mesh)
>>> cube_axes_actor = pv.CubeAxesActor(pl.camera)
>>> cube_axes_actor.bounds = mesh.bounds
>>> actor, property = pl.add_actor(cube_axes_actor)
>>> pl.show()

Methods#
|
Update the bounds of this actor. |
Attributes#
Return or set the bounding box. |
|
Return or set the camera that performs scaling and translation. |
|
Return the center. |
|
Return or set the distance between labels and the axis. |
|
Number of labels on the x-axis. |
|
Number of labels on the y-axis. |
|
Number of labels on the z-axis. |
|
Return or set how the ticks are drawn on the axes grid. |
|
Return or set the distance between title and labels. |
|
Use the 2d render mode. |
|
Return or set visibility of the x-axis minior tick. |
|
Return or set the x-axis range. |
|
Return or set the visibility of the x-axis. |
|
Return or set the label of the x-axis. |
|
Return or set the visibility of the x-axis labels. |
|
Return the x-axis labels. |
|
Return or set the title of the x-axis. |
|
Return or set visibility of the y-axis minior tick. |
|
Return or set the y-axis range. |
|
Return or set the visibility of the y-axis. |
|
Return or set the label of the y-axis. |
|
Return or set the visibility of the y-axis labels. |
|
Return the y-axis labels. |
|
Return or set the title of the y-axis. |
|
Return or set visibility of the z-axis minior tick. |
|
Return or set the z-axis range. |
|
Return or set the visibility of the y-axis. |
|
Return or set the label of the z-axis. |
|
Return or set the visibility of the z-axis labels. |
|
Return the z-axis labels. |
|
Return or set the title of the z-axis. |