plot_wave#
- plot_wave(fps=30, frequency=1, wavetime=3, notebook=None)[source]#
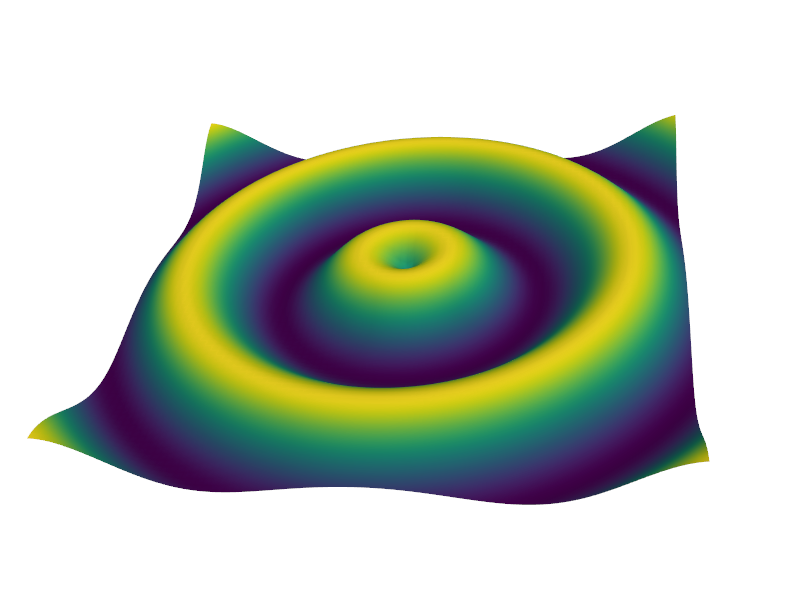
Plot a 3D moving wave in a render window.
- Parameters:
- fps
int, default: 30 Maximum frames per second to display.
- frequency
float, default: 1.0 Wave cycles per second (Hz).
- wavetime
float, default: 3.0 The desired total display time in seconds.
- notebookbool,
optional When
True, the resulting plot is placed inline a jupyter notebook. Assumes a jupyter console is active.
- fps
- Returns:
numpy.ndarrayPosition of points at last frame.
Examples
>>> from pyvista import demos
>>> out = demos.plot_wave()