pyvista.demos.demos.plot_glyphs#
- plot_glyphs(grid_sz=3, **kwargs)[source]#
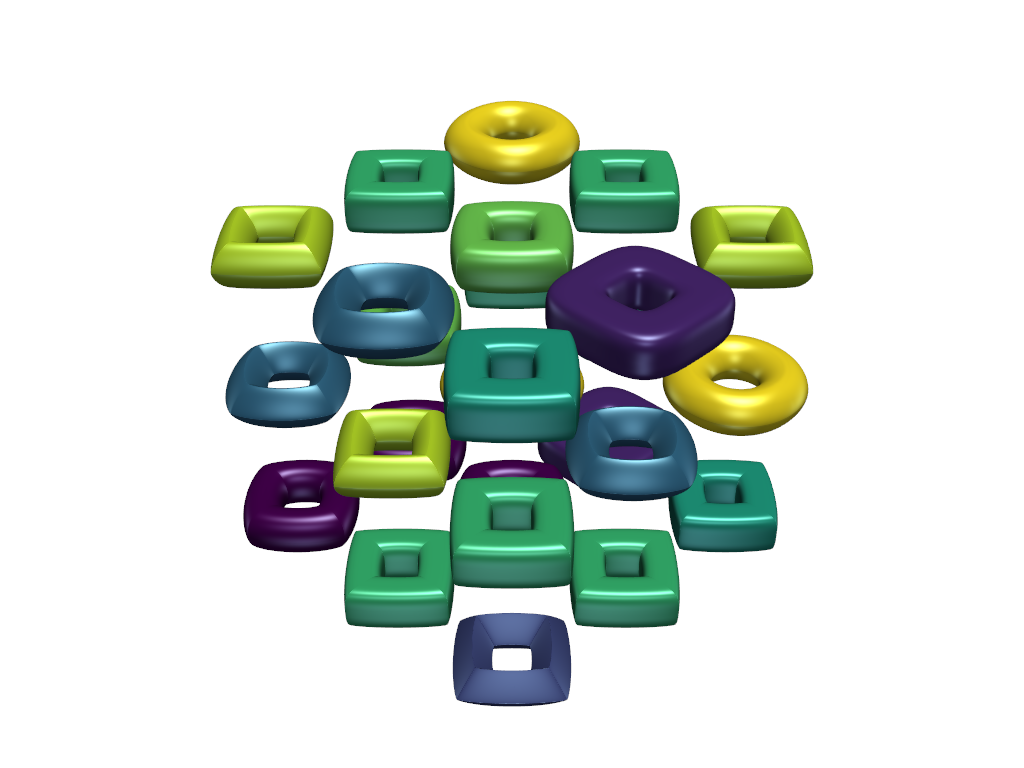
Plot several parametric supertoroids using VTK’s glyph table functionality.
- Parameters:
- grid_sz
int, default: 3 Create
grid_sz x grid_szsupertoroids.- **kwargs
dict,optional All additional keyword arguments will be passed to
pyvista.Plotter.add_mesh().
- grid_sz
- Returns:
- output
list|np.ndarray|ipywidgets.Widget See
show.
- output
Examples
>>> from pyvista import demos
>>> demos.plot_glyphs()
