plot_ants_plane#
- plot_ants_plane(notebook=None)[source]#
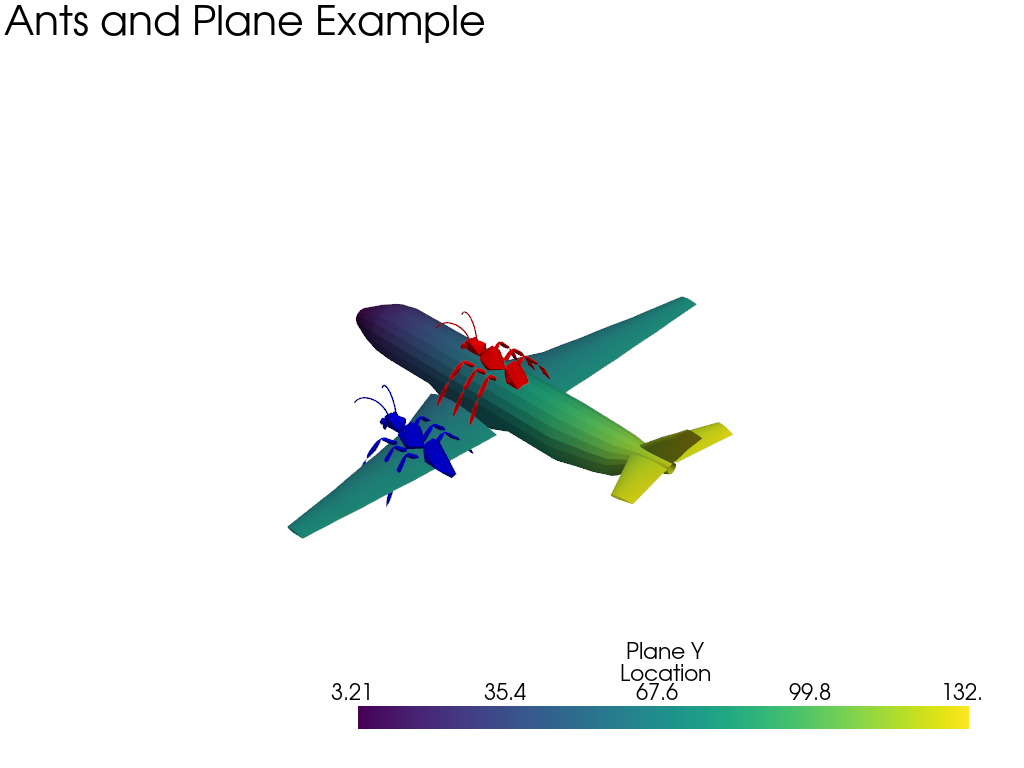
Plot two ants and airplane.
Demonstrate how to create a plot class to plot multiple meshes while adding scalars and text.
This example plots the following:
>>> import pyvista as pv
>>> from pyvista import examples

Load and shrink airplane

>>> airplane = examples.load_airplane()
>>> airplane.points /= 10

Rotate and translate ant so it is on the plane.

>>> ant = examples.load_ant()
>>> _ = ant.rotate_x(90, inplace=True)
>>> _ = ant.translate([90, 60, 15], inplace=True)

Make a copy and add another ant.

>>> ant_copy = ant.translate([30, 0, -10], inplace=False)

Create plotting object.

>>> pl = pv.Plotter()
>>> _ = pl.add_mesh(ant, color='r')
>>> _ = pl.add_mesh(ant_copy, color='b')

Add airplane mesh and make the color equal to the Y position.

>>> plane_scalars = airplane.points[:, 1]
>>> _ = pl.add_mesh(
...     airplane,
...     scalars=plane_scalars,
...     scalar_bar_args={'title': 'Plane Y Location'},
... )
>>> _ = pl.add_text('Ants and Plane Example')
>>> pl.show()
- Parameters:
- notebookbool,
optional When
True, the resulting plot is placed inline a jupyter notebook. Assumes a jupyter console is active.
- notebookbool,
Examples
>>> from pyvista import demos
>>> demos.plot_ants_plane()