
Plotter.add_ruler#
- Plotter.add_ruler(
- pointa: VectorLikeFloat,
- pointb: VectorLikeFloat,
- *,
- flip_range: bool = False,
- flip_side: bool = False,
- number_labels: int | None = None,
- snap_labels: bool = False,
- show_labels: bool = True,
- font_size_factor: float = 0.6,
- label_size_factor: float = 1.0,
- label_format: str | None = None,
- title: str = 'Distance',
- number_minor_ticks: int = 0,
- tick_length: int = 5,
- minor_tick_length: int = 3,
- show_ticks: bool = True,
- tick_label_offset: int = 2,
- label_color: ColorLike | None = None,
- tick_color: ColorLike | None = None,
- scale: float = 1.0,
Add ruler.
The ruler is a 2D object that is not occluded by 3D objects. To avoid issues with perspective, it is recommended to use parallel projection, that is,
Plotter.enable_parallel_projection(), and place the ruler orthogonal to the viewing direction.The labels are placed to the right of the ruler moving from
pointatopointb, so two rulers pointing opposite ways carry their labels on opposite sides. Useflip_sideto move them across, andflip_rangeto flip the0location.Since the ruler is placed in an overlay on the viewing scene, the camera does not automatically reset to include the ruler in the view.
- Parameters:
- pointa
VectorLikeFloat Starting point for ruler.
- pointb
VectorLikeFloat Ending point for ruler.
- flip_rangebool, default:
False If
True, the distance range goes frompointbtopointa.- flip_sidebool, default:
False If
True, the labels and ticks are drawn on the other side of the ruler. The distances they report are unchanged.Added in version 0.50.
- number_labels
int, optional Number of labels to place on the ruler, at least
2. If not supplied, the number is adjusted for “nice” values.Note
Below VTK 9.6 the maximum is
25.- snap_labelsbool, default:
False If
True, the labels are placed on round values andnumber_labelsbecomes a target rather than an exact count. The far end of the ruler carries a label only when a round value lands on it.Note
Requires VTK 9.4 or newer.
Added in version 0.50.
- show_labelsbool, default:
True Whether to show labels.
- font_size_factor
float, default: 0.6 Factor to scale font size overall.
- label_size_factor
float, default: 1.0 Factor to scale label size relative to title size.
- label_format
str, optional A
printfstyle format for labels, for example, ‘%E’.- title
str, default: “Distance” The title to display.
- number_minor_ticks
int, default: 0 Number of minor ticks between major ticks.
- tick_length
int, default: 5 Length of ticks in pixels.
- minor_tick_length
int, default: 3 Length of minor ticks in pixels.
- show_ticksbool, default:
True Whether to show the ticks.
- tick_label_offset
int, default: 2 Offset between tick and label in pixels.
- label_color
ColorLike, optional Either a string, rgb list, or hex color string for label and title colors.
- tick_color
ColorLike, optional Either a string, rgb list, or hex color string for tick line colors.
- scale
float, default: 1.0 Scale factor for the ruler.
Added in version 0.44.0.
- pointa
- Returns:
- vtkAxisActor2D
Actor of the ruler.
Examples#
Download Python source code | Download Jupyter notebook
>>> import pyvista as pv
>>> cone = pv.Cone(height=2.0, radius=0.5)
>>> pl = pv.Plotter()
>>> _ = pl.add_mesh(cone)
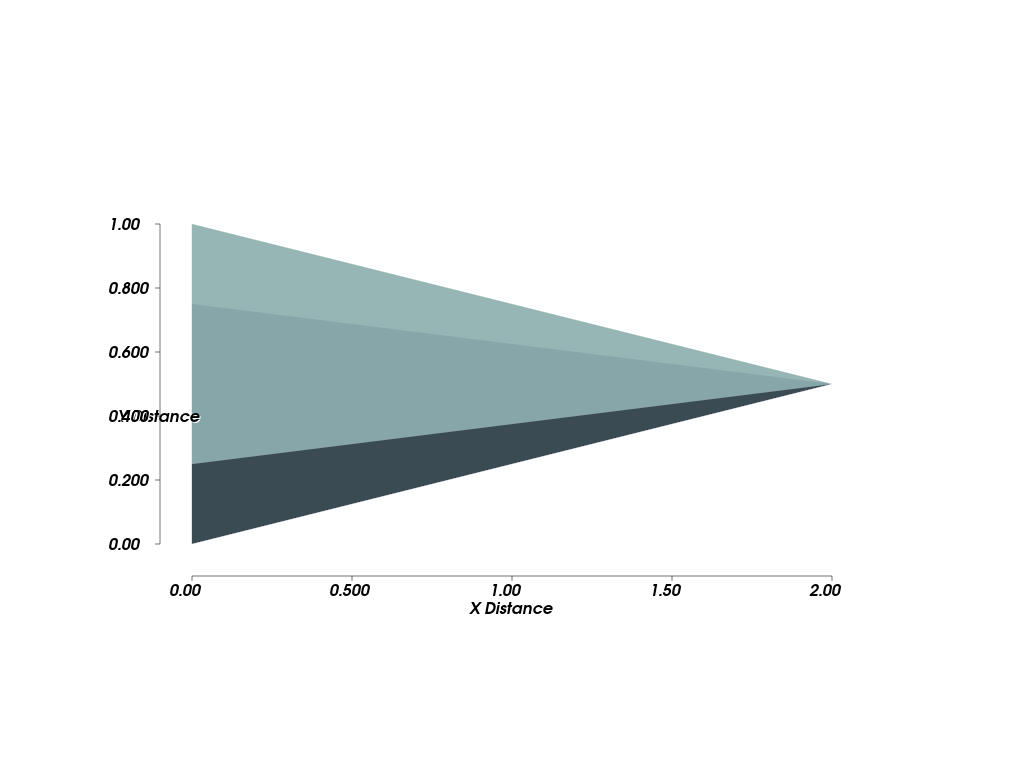
Measure x direction of cone and place ruler slightly below.
>>> _ = pl.add_ruler(
...     pointa=[cone.bounds.x_min, cone.bounds.y_min - 0.1, 0.0],
...     pointb=[cone.bounds.x_max, cone.bounds.y_min - 0.1, 0.0],
...     title='X Distance',
... )
Measure y direction of cone and place ruler slightly to left. The labels
are placed to the right of the ruler when traveling from pointa to
pointb.
>>> _ = pl.add_ruler(
...     pointa=[cone.bounds.x_min - 0.1, cone.bounds.y_max, 0.0],
...     pointb=[cone.bounds.x_min - 0.1, cone.bounds.y_min, 0.0],
...     flip_range=True,
...     title='Y Distance',
... )
>>> pl.enable_parallel_projection()
>>> pl.view_xy()
>>> pl.show()
Used In#
API Examples
Renderer.add_ruler(1 use)
