Plotter.add_chart#
Examples#
Download Python source code | Download Jupyter notebook
>>> import pyvista as pv
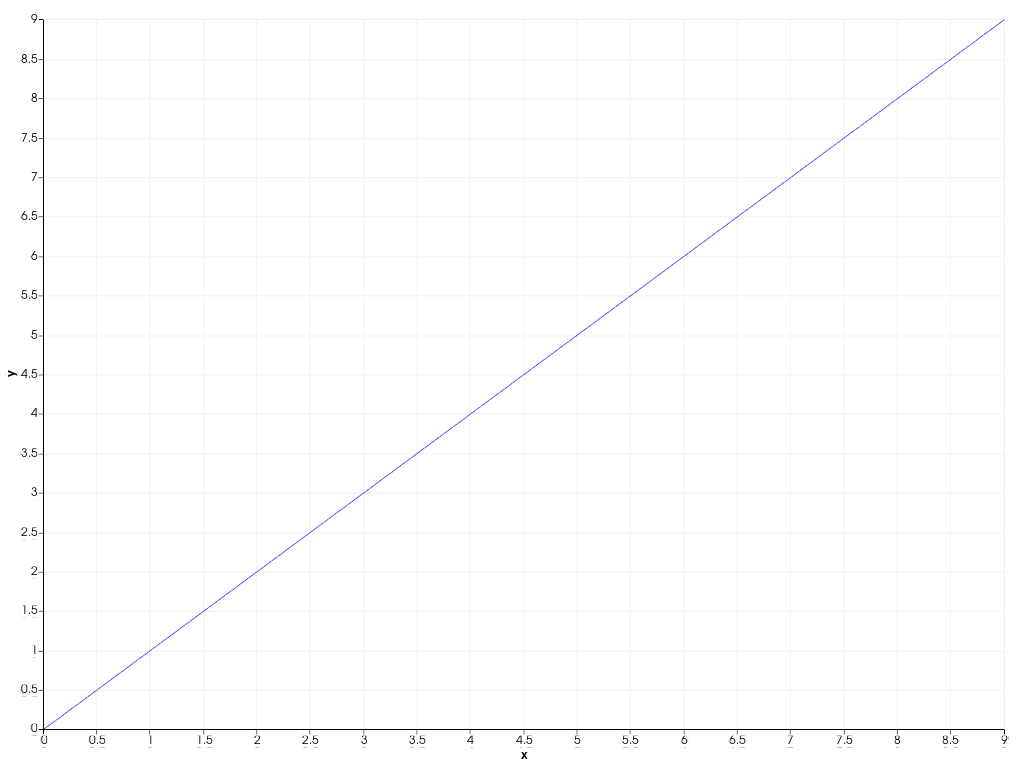
>>> chart = pv.Chart2D()
>>> _ = chart.plot(range(10), range(10))
>>> pl = pv.Plotter()
>>> pl.add_chart(chart)
>>> pl.show()
Used In#
API Examples
Plotter.remove_chart(1 use)Renderer.add_chart(1 use)Renderer.get_charts(1 use)Renderer.remove_chart(1 use)
Gallery Examples