
Dashed Lines#
Download Python source code | Download Jupyter notebook
Dash a line by splitting its cells with a filter, or by dashing it in the shader.
PyVista offers two ways to dash a line, and they differ in where the dashes come
from. dash_lines() is a filter: it cuts the line
cells into shorter cells, so the dashes are real geometry. The
line_style property instead discards fragments while
rendering, so the geometry is untouched.
Both accept the same style strings.
Style |
Description |
Example |
|---|---|---|
|
Hidden |

|
|
Solid |

|
|
Dashed |

|
|
Dotted |

|
|
Dash-dot |

|
|
Dash-dot-dot |

|
import numpy as np
import pyvista as pv
Build a Helix#
A single polyline is enough to show both approaches.
theta = np.linspace(0, 4 * np.pi, 400)
helix = pv.Spline(
    np.column_stack([np.cos(theta), np.sin(theta), np.linspace(-1.5, 1.5, 400)]),
    400,
)
helix
Dash the Geometry With a Filter#
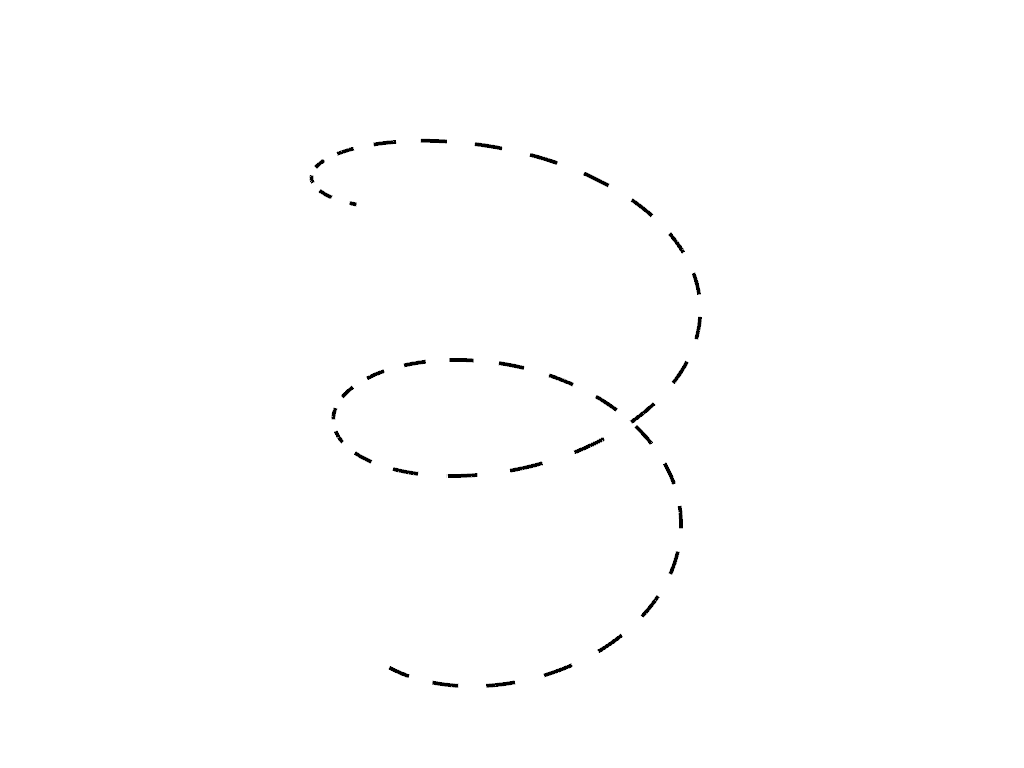
dash_lines() returns a new dataset holding only
the drawn parts of the line.
pl = pv.Plotter()
pl.add_mesh(helix.dash_lines('--'), color='black', line_width=4)
pl.view_isometric()
pl.show()
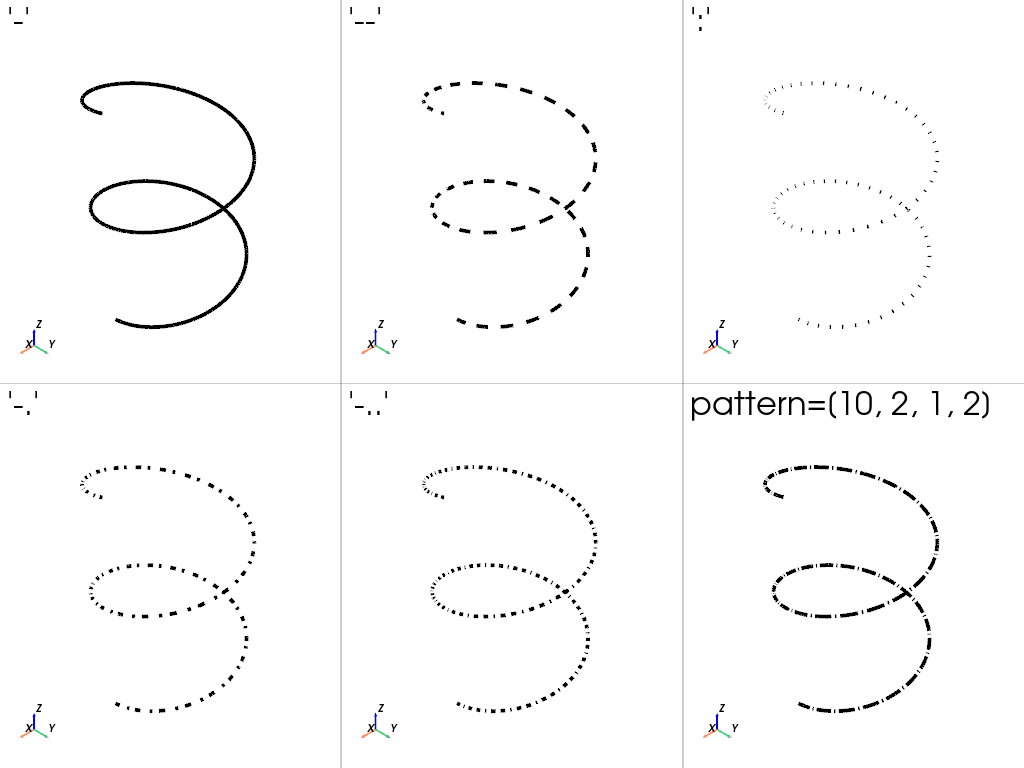
Every named style is available. '-' is solid, so it returns the lines
whole. pattern takes lengths of alternating drawn and undrawn intervals
instead of a style, so [10, 2, 1, 2] draws ten, skips two, draws one and
skips two, then repeats.
styles = ['-', '--', ':', '-.', '-..']
pattern = [10, 2, 1, 2]

dashed = {f"'{style}'": helix.dash_lines(style) for style in styles}
dashed[f'pattern={pattern}'] = helix.dash_lines(pattern=pattern)

pv.plot_compare(dashed, color='black', line_width=4, cpos='iso')
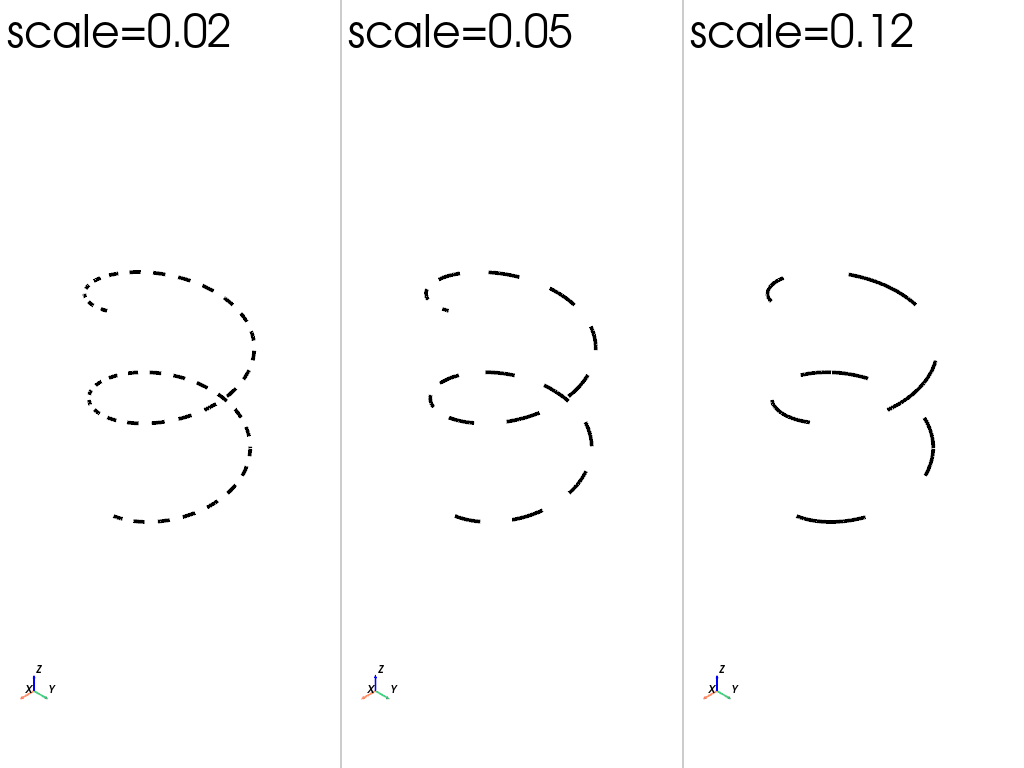
scale sets the length of one pattern interval in world units, so shorter
values give finer dashes.
pv.plot_compare(
    {
        f'scale={scale}': helix.dash_lines('--', scale=scale)
        for scale in [0.02, 0.05, 0.12]
    },
    color='black',
    line_width=4,
    cpos='iso',
)
Dash the Rendering With a Shader#
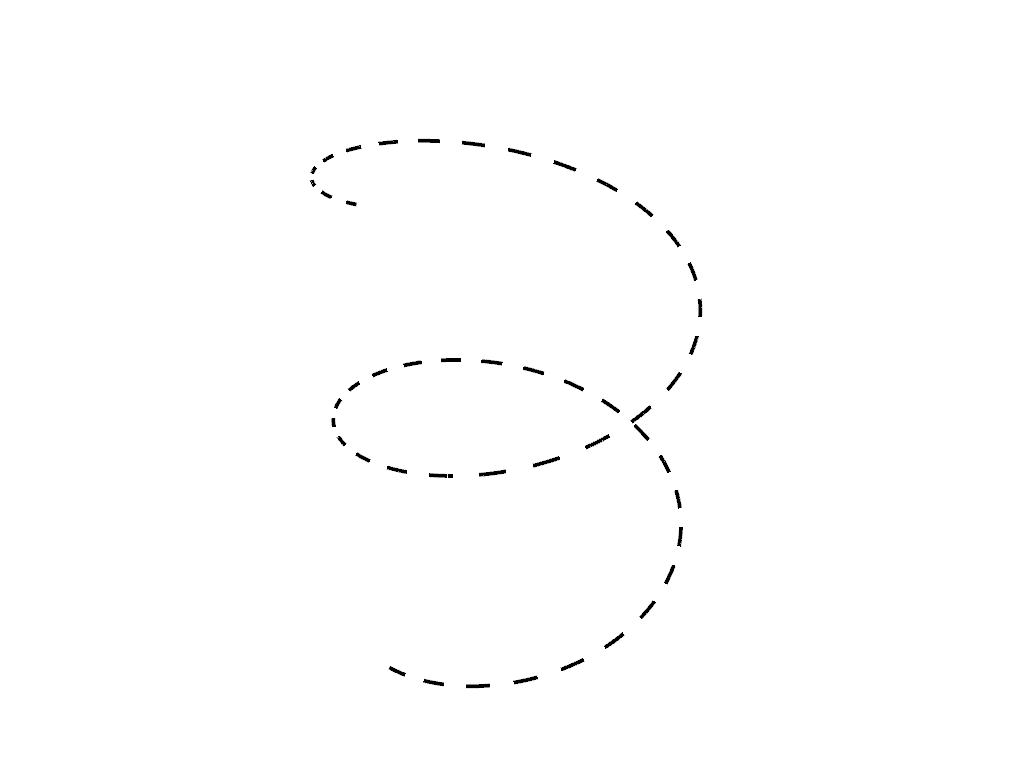
Passing line_style to add_mesh() dashes the same
helix without touching its cells.
pl = pv.Plotter()
pl.add_mesh(helix, color='black', line_width=4, line_style='--')
pl.view_isometric()
pl.show()
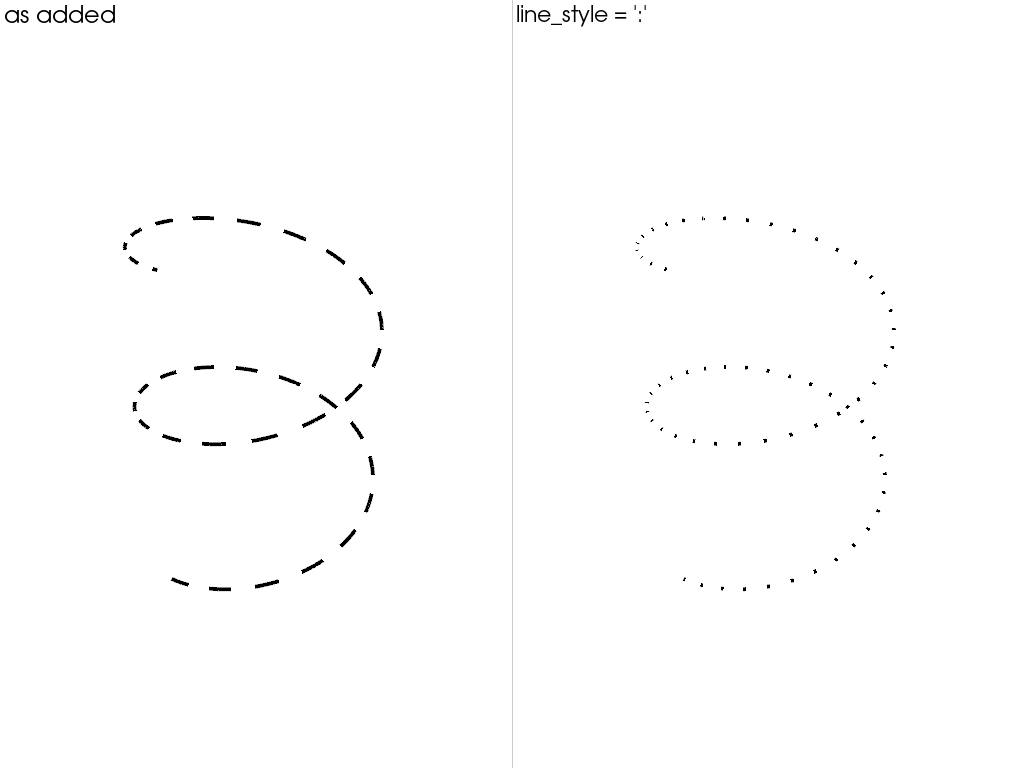
The style belongs to the actor, so line_style changes it
after the mesh is added.
pl = pv.Plotter(shape=(1, 2))

pl.subplot(0, 0)
pl.add_mesh(helix, color='black', line_width=4, line_style='--')
pl.add_text('as added', font_size=10)

pl.subplot(0, 1)
actor = pl.add_mesh(helix, color='black', line_width=4, line_style='--')
actor.line_style = ':'
pl.add_text(f'line_style = {actor.line_style!r}', font_size=10)

pl.link_views()
pl.view_isometric()
pl.show()
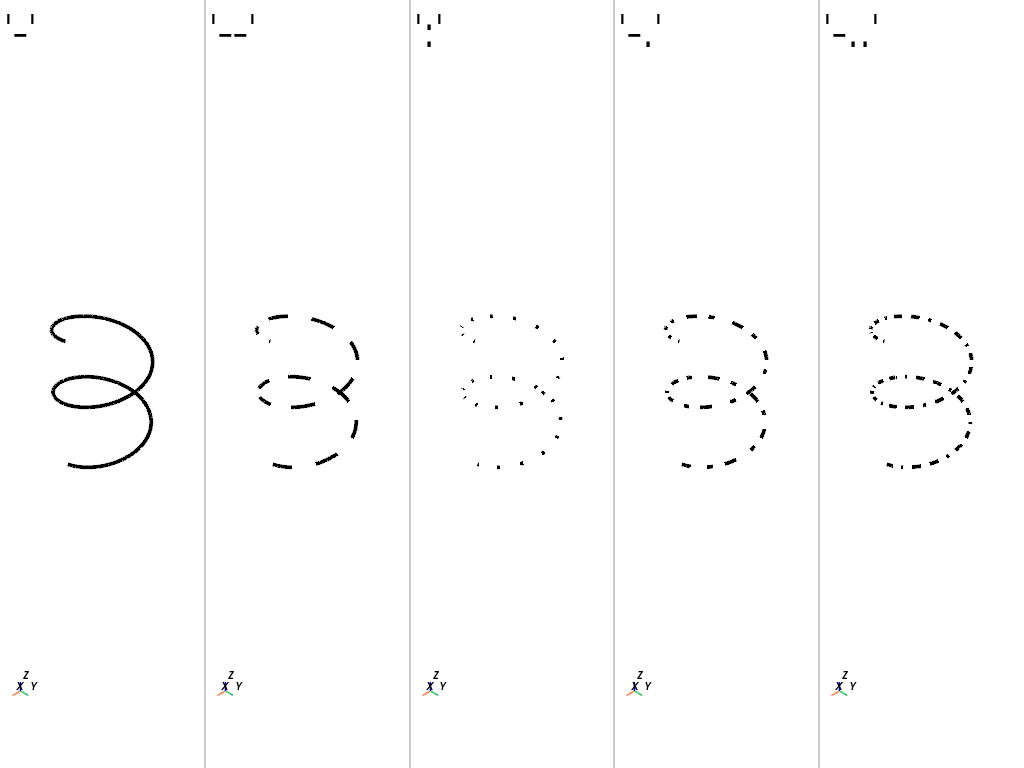
The same named styles apply, but there is no pattern: the shader draws
only the named ones.
pv.plot_compare(
    [helix] * len(styles),
    labels=[f"'{style}'" for style in styles],
    line_style=styles,
    color='black',
    line_width=4,
    cpos='iso',
    shape=(1, 5),
)
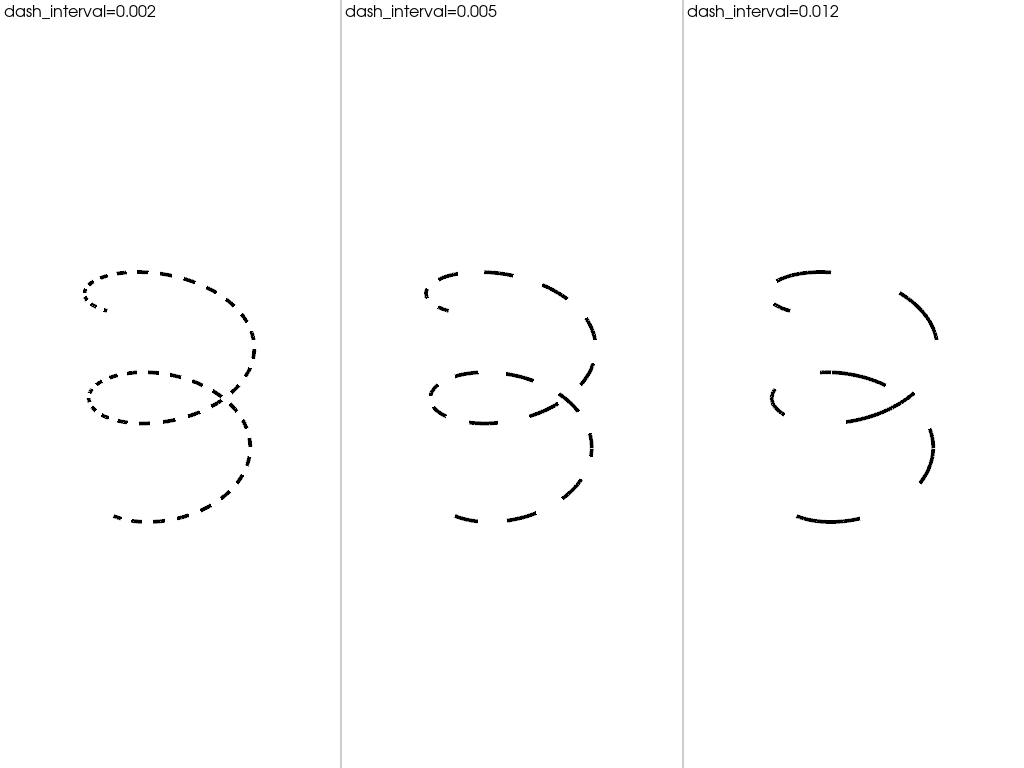
Here the dash length is set on the actor with
dash_interval, as a fraction of the window height.
pl = pv.Plotter(shape=(1, 3))
for index, interval in enumerate([0.002, 0.005, 0.012]):
    pl.subplot(0, index)
    actor = pl.add_mesh(helix, color='black', line_width=4, line_style='--')
    actor.dash_interval = interval
    pl.add_text(f'dash_interval={interval}', font_size=10)
pl.link_views()
pl.view_isometric()
pl.show()
Comparing the Two#
The filter replaces one polyline with many short ones. The shader leaves the cell count alone.
print('input            ', helix.n_cells, 'cell')
print('dash_lines output', helix.dash_lines('--').n_cells, 'cells')
input             1 cell
dash_lines output 40 cells
That difference shows up as soon as the camera moves. Filter dashes are fixed in world units, so they grow with the geometry when you zoom in. Shader dashes are measured on screen, so they keep their size.
both = {'filter': helix.dash_lines('--'), 'shader': helix}
options = dict(line_style=[None, '--'], color='black', line_width=4, cpos='iso')

pv.plot_compare(both, **options)
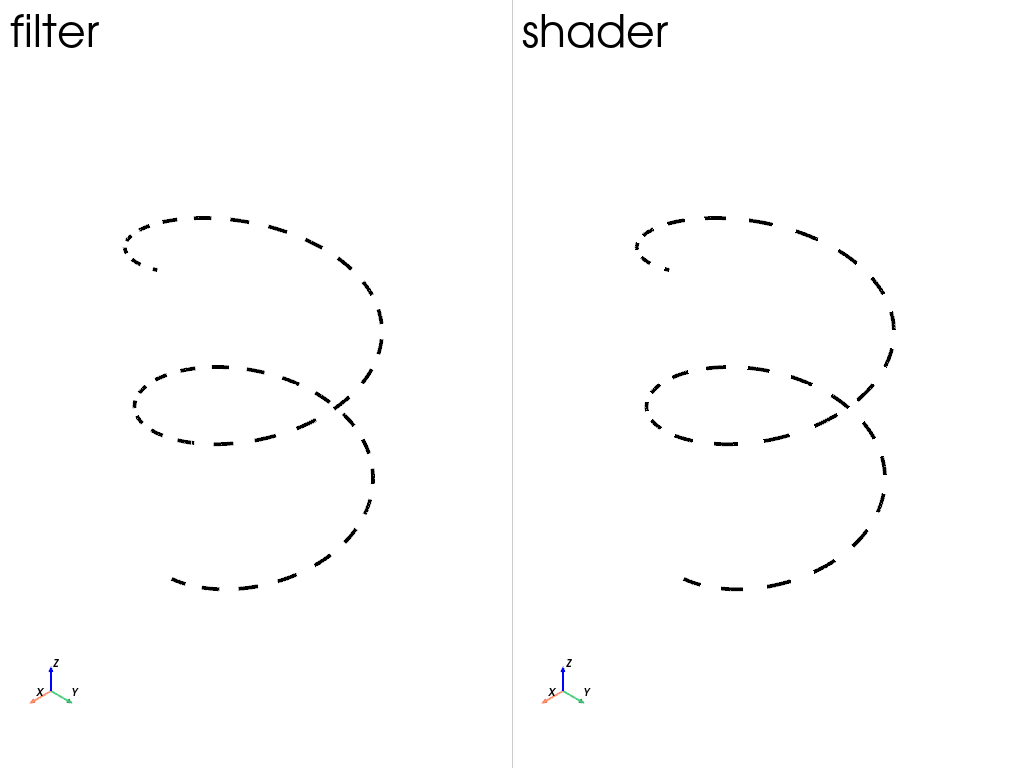
Zoomed in, the filter dashes have grown with the geometry while the shader dashes have kept their size.
pv.plot_compare(both, **options, zoom=3)
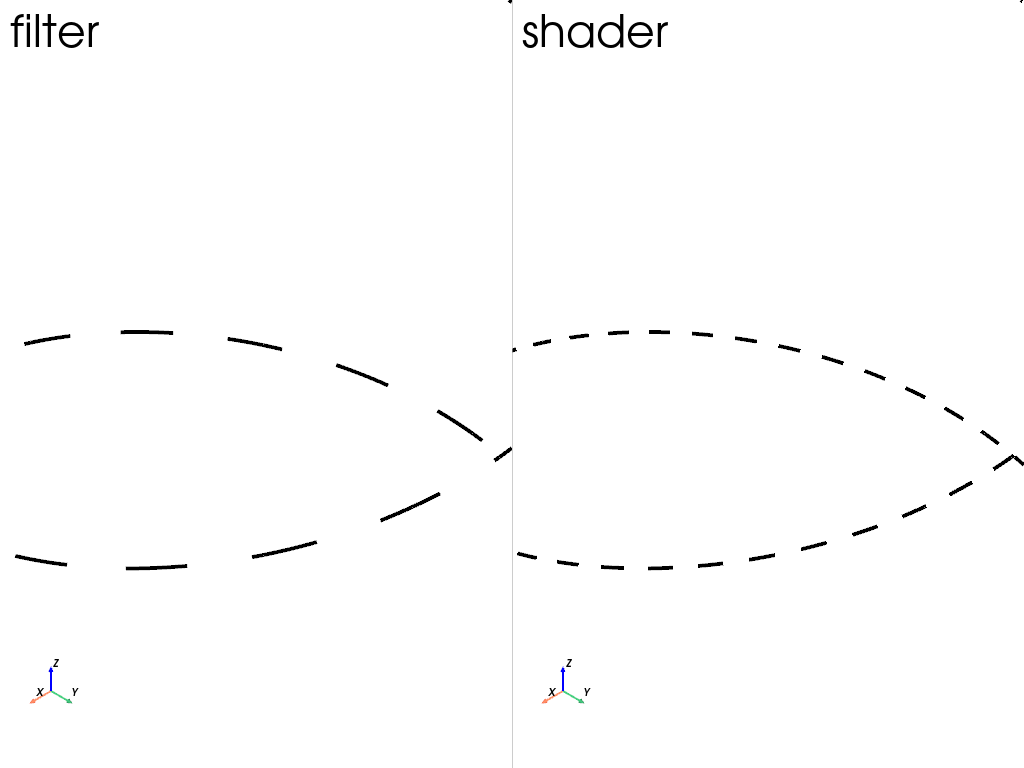
Only the filter survives being written to a file or exported to the browser, since only it produces real dashed geometry.
Dashing the Edges of a Surface#
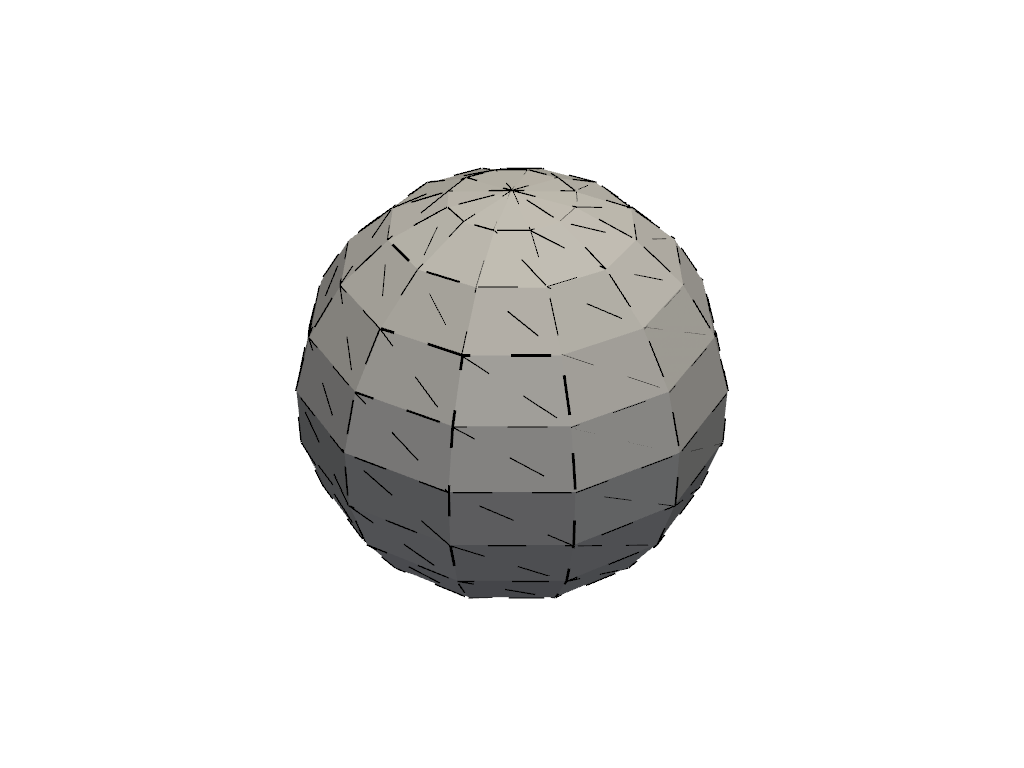
Neither option touches the edges drawn by show_edges=True, which come from
the polygons rather than from line cells. Extract the edges first and dash them
as their own mesh.
sphere = pv.Sphere(theta_resolution=12, phi_resolution=12)
edges = sphere.extract_all_edges().dash_lines('--', scale=0.01)

pl = pv.Plotter()
pl.add_mesh(sphere, color='lightgray')
pl.add_mesh(edges, color='black', line_width=3)
pl.view_isometric()
pl.show()
Total running time of the script: (0 minutes 1.495 seconds)
