
Plot Vector Component#
Download Python source code | Download Jupyter notebook
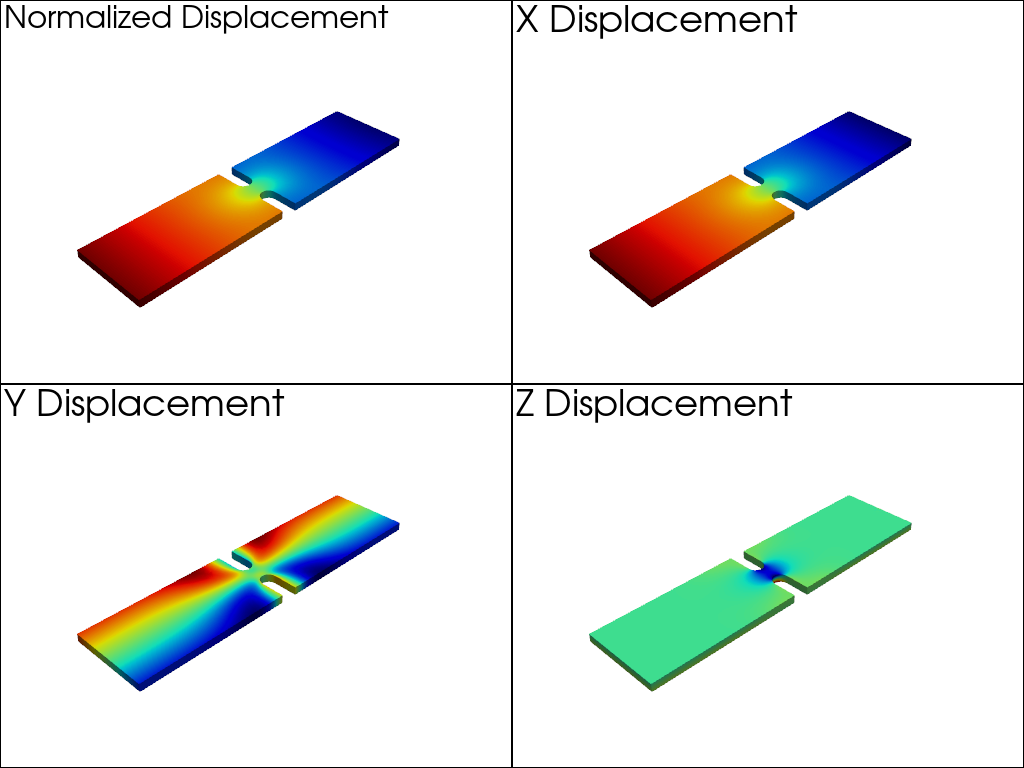
Plot a single component of a vector as a scalar array.
We can plot individual components of multi-component arrays with the
component argument of the add_mesh() method.
import pyvista as pv
from pyvista import examples
Download an example notched beam stress
The default behavior with no component specified is to use the vector magnitude. We can access each component by specifying the component argument.
dargs = dict(
    scalars='Nodal Displacement',
    cmap='jet',
    show_scalar_bar=False,
)

pl = pv.Plotter(shape=(2, 2))
pl.subplot(0, 0)
pl.add_mesh(mesh, **dargs)
pl.add_text('Normalized Displacement', color='k')
pl.subplot(0, 1)
pl.add_mesh(mesh.copy(), component=0, **dargs)
pl.add_text('X Displacement', color='k')
pl.subplot(1, 0)
pl.add_mesh(mesh.copy(), component=1, **dargs)
pl.add_text('Y Displacement', color='k')
pl.subplot(1, 1)
pl.add_mesh(mesh.copy(), component=2, **dargs)
pl.add_text('Z Displacement', color='k')
pl.link_views()
pl.camera_position = 'iso'
pl.background_color = 'white'
pl.show()
Total running time of the script: (0 minutes 0.443 seconds)
