
Computing Mesh Quality#
Download Python source code | Download Jupyter notebook
Leverage powerful VTK algorithms for computing mesh quality.
Here we will use the cell_quality() filter
to compute the cell qualities. The following quality measures are available
for various cell types:
Measure |
||||||
|---|---|---|---|---|---|---|
|
||||||
|
||||||
|
||||||
|
||||||
|
||||||
|
||||||
|
||||||
|
||||||
|
||||||
|
||||||
|
||||||
|
||||||
|
||||||
|
||||||
|
||||||
|
||||||
|
||||||
|
||||||
|
||||||
|
||||||
|
||||||
|
||||||
|
||||||
|
||||||
|
||||||
|
||||||
|
||||||
|
import pyvista as pv
from pyvista import examples
Triangle Cell Quality#
Load a PolyData mesh and decimate()
it to show coarse TRIANGLE cells for the example.
Here we use download_cow().
mesh = examples.download_cow().triangulate().decimate(0.7)
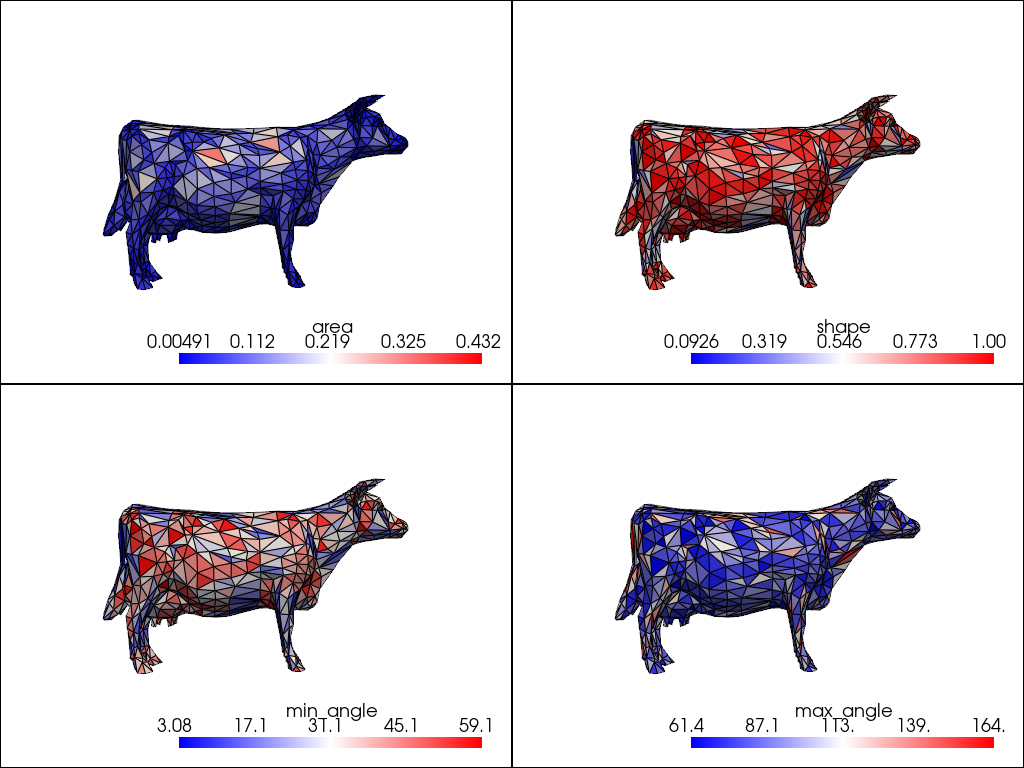
Compute some valid measures for triangle cells.
measures = ['area', 'shape', 'min_angle', 'max_angle']
qual = mesh.cell_quality(measures)
Plot the meshes in subplots for comparison with plot_compare().
Every subplot is drawn with the same arguments, so we compute each measure
separately: cell_quality() makes the measure
it computes the active scalars.
plot_kwargs = dict(cmap='bwr', show_edges=True)

datasets = {measure: mesh.cell_quality(measure) for measure in measures}

pv.plot_compare(datasets, cpos='xy', **plot_kwargs)
Visualize Acceptable Range#
The previous plots show the full range of cell quality values present in the mesh.
However, it may be more useful to show the acceptable range of values instead.
Get the acceptable range for the shape quality measure using
cell_quality_info().
info = pv.cell_quality_info('TRIANGLE', 'shape')
print(info)
CellQualityInfo(cell_type=<CellType.TRIANGLE: 5>, quality_measure='shape', acceptable_range=(0.25, 1.0), normal_range=(0.0, 1.0), full_range=(0.0, 1.0), unit_cell_value=1.0)
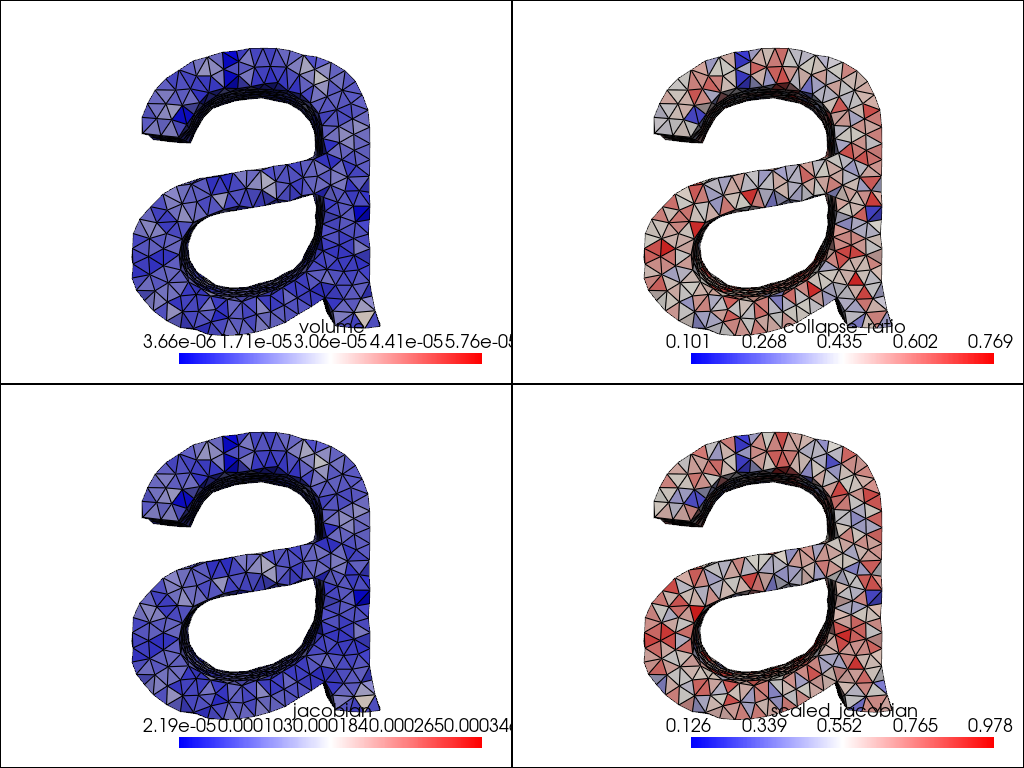
Plot the shape quality measure again but this time we color the cells based on the acceptable range for the measure. Cells outside of this range are saturated as blue or red and may be considered to be “poor” quality cells.
qual.plot(
    scalars='shape',
    clim=info.acceptable_range,
    cmap='bwr',
    below_color='blue',
    above_color='red',
    cpos='xy',
    zoom=1.5,
    show_axes=False,
)
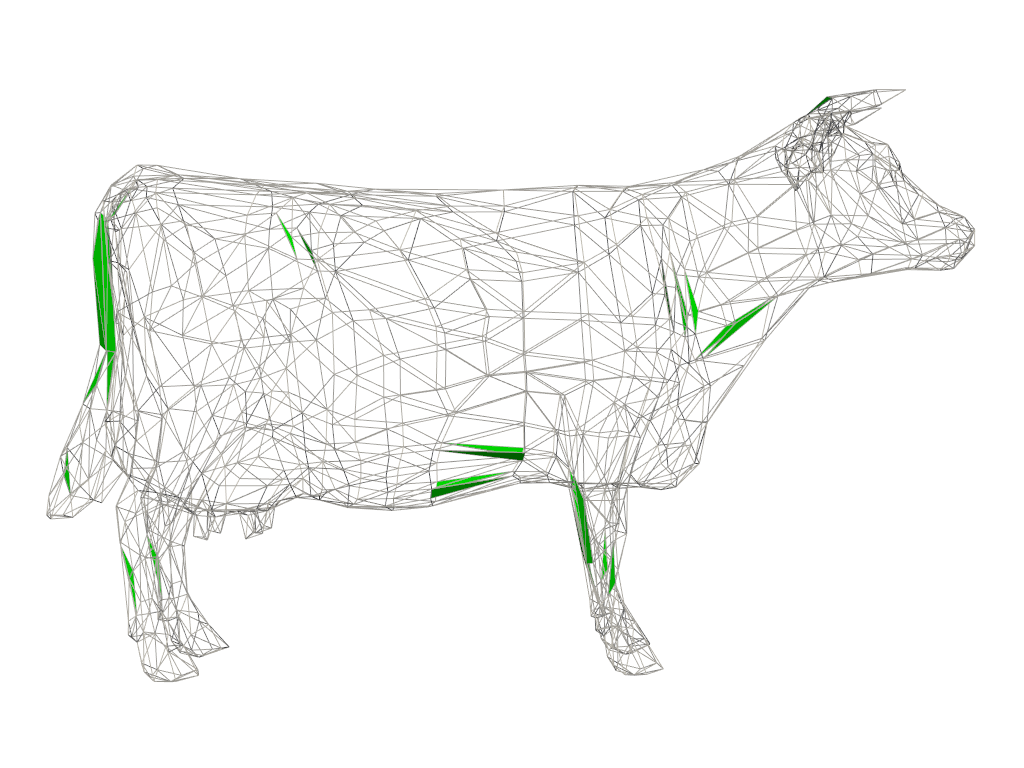
Use extract_values() to extract the “poor” quality
cells outside the acceptable range.
unacceptable = qual.extract_values(
    scalars='shape', ranges=info.acceptable_range, invert=True
)
Plot the unacceptable cells along with the original mesh as wireframe for context.
pl = pv.Plotter()
pl.add_mesh(mesh, style='wireframe', color='light gray')
pl.add_mesh(unacceptable, color='lime')
pl.view_xy()
pl.camera.zoom(1.5)
pl.show()
Tetrahedron Cell Quality#
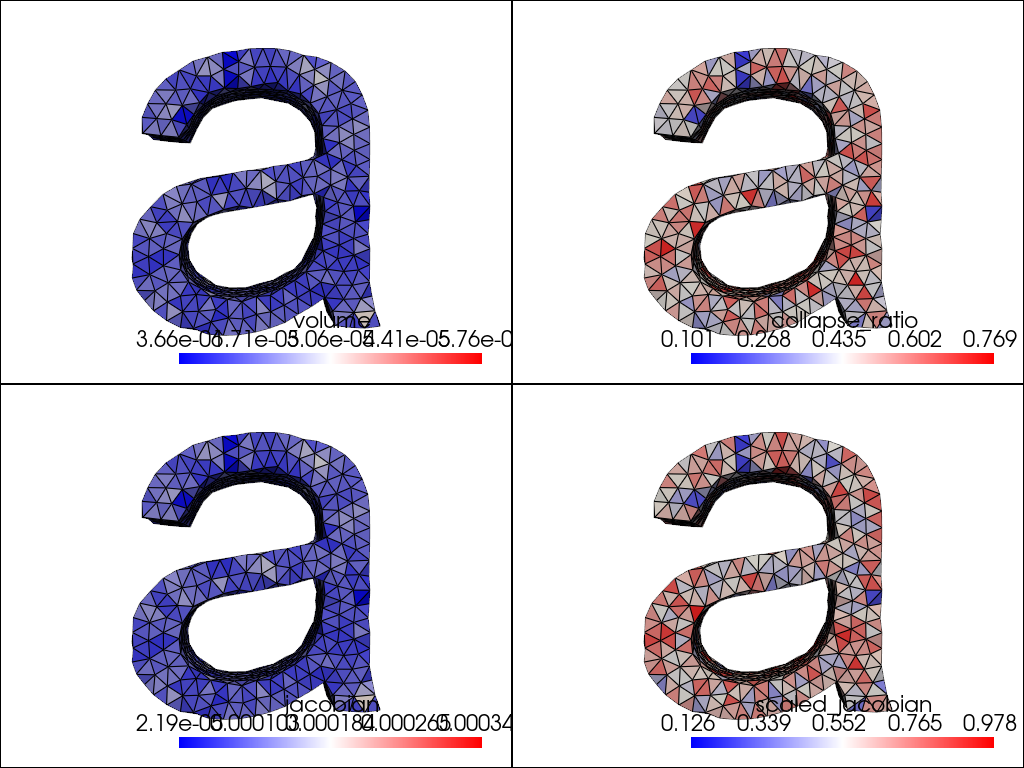
Load a mesh with TETRA cells. Here we use
download_letter_a().
Plot some valid quality measures for tetrahedral cells.
measures = ['volume', 'collapse_ratio', 'jacobian', 'scaled_jacobian']

datasets = {measure: mesh.cell_quality(measure) for measure in measures}

pv.plot_compare(datasets, cpos='xy', **plot_kwargs)
Total running time of the script: (0 minutes 1.005 seconds)
