
Axis.log_scale#
- property Axis.log_scale[source]#
Flag denoting whether a log scale is used for this axis.
Note that setting this property to
Truewill not guarantee that the log scale will be enabled. Verify whether activating the log scale succeeded by rereading this property.
Examples#
Download Python source code | Download Jupyter notebook
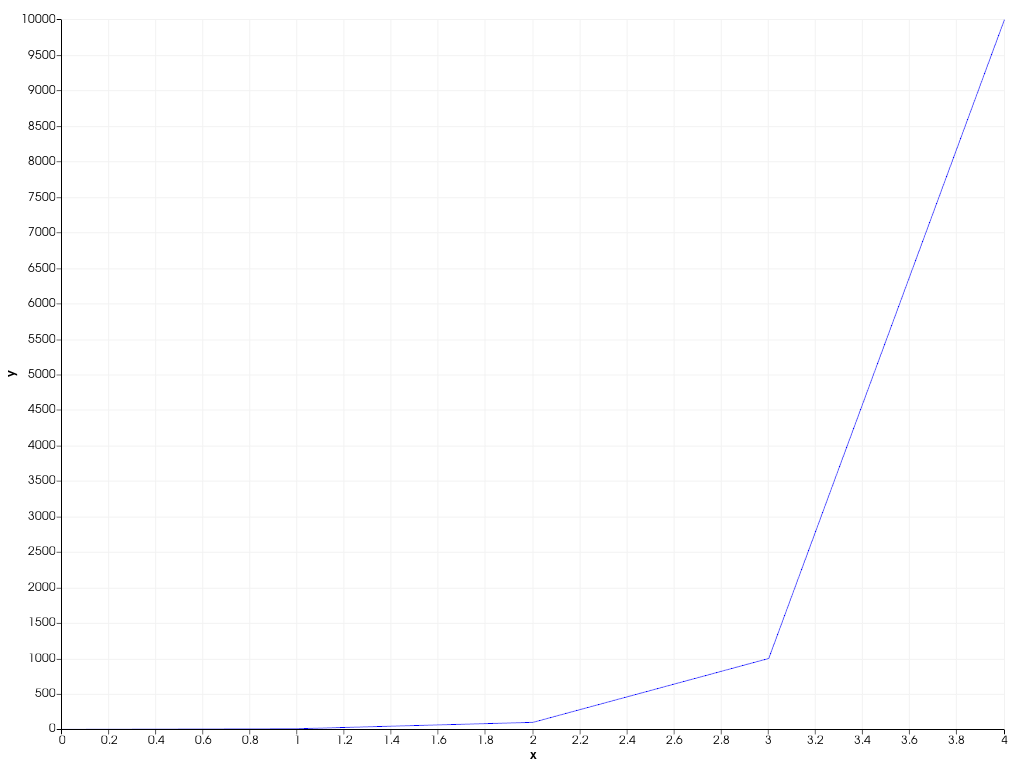
Create a 2D chart.
>>> import pyvista as pv
>>> chart = pv.Chart2D()
>>> _ = chart.line([0, 1, 2, 3, 4], [1e0, 1e1, 1e2, 1e3, 1e4])
>>> chart.show()
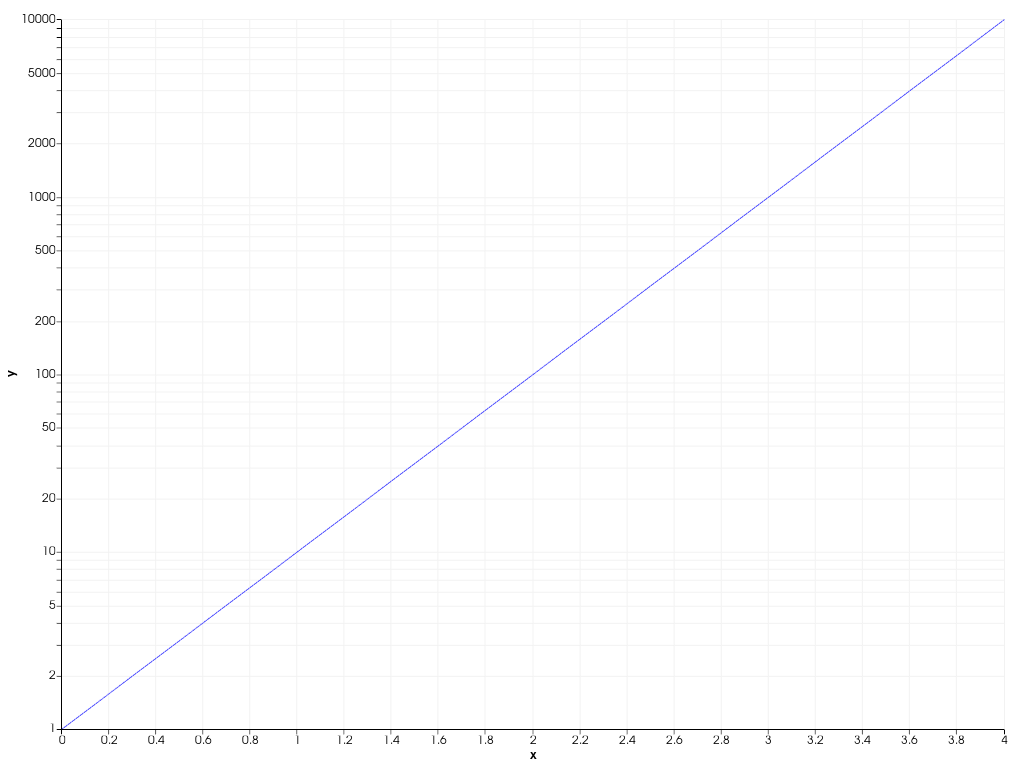
Try to enable the log scale on the y-axis.
>>> chart.y_axis.log_scale = True
>>> chart.show()
>>> chart.y_axis.log_scale
True
