Axis.tick_labels#
- property Axis.tick_labels[source]#
Return or set the tick labels for this axis.
You can specify a sequence, to provide a unique label to every tick position; a string, to describe the label format to use for each label; or
None, which will revert back to the default tick labels. A label format is a string consisting of an integer part, denoting the precision to use, and a final character, denoting the notation to use.Allowed notations:
"f"for fixed notation"e"for scientific notation.
Examples#
Download Python source code | Download Jupyter notebook
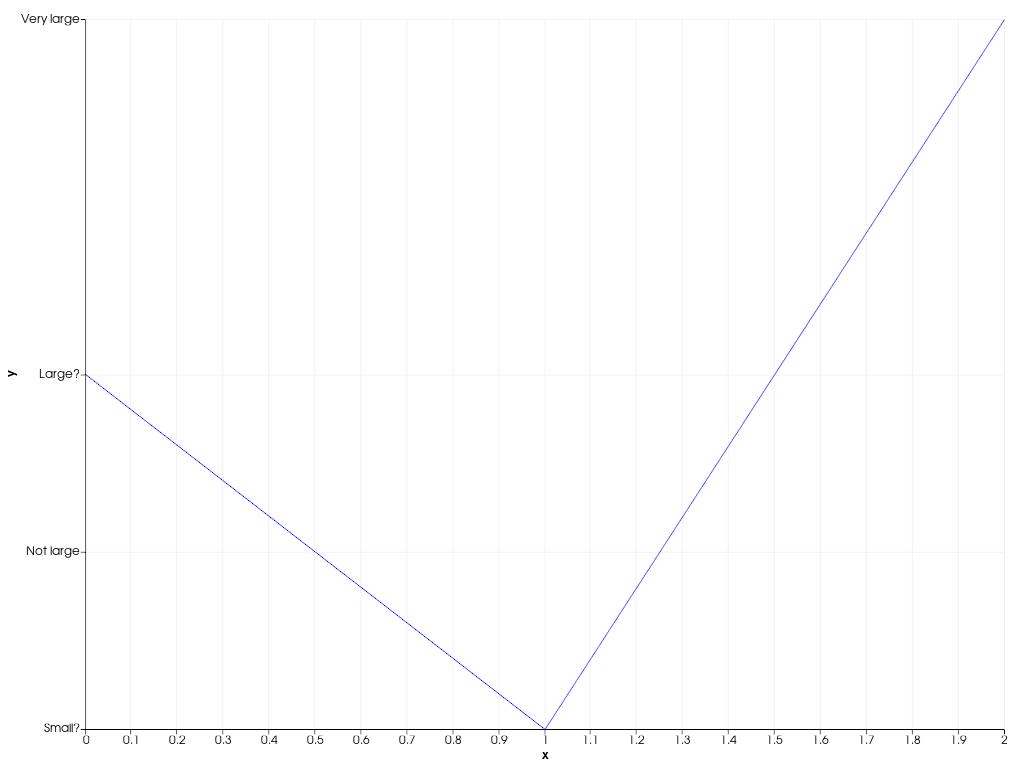
Create a 2D chart with custom tick locations and labels on the y-axis.
>>> import pyvista as pv
>>> chart = pv.Chart2D()
>>> _ = chart.line([0, 1, 2], [2, 1, 3])
>>> chart.y_axis.tick_locations = (0.2, 0.4, 0.6, 1, 1.5, 2, 3)
>>> chart.y_axis.tick_labels = [
...     'Very small',
...     'Small',
...     'Still small',
...     'Small?',
...     'Not large',
...     'Large?',
...     'Very large',
... ]
>>> chart.show()
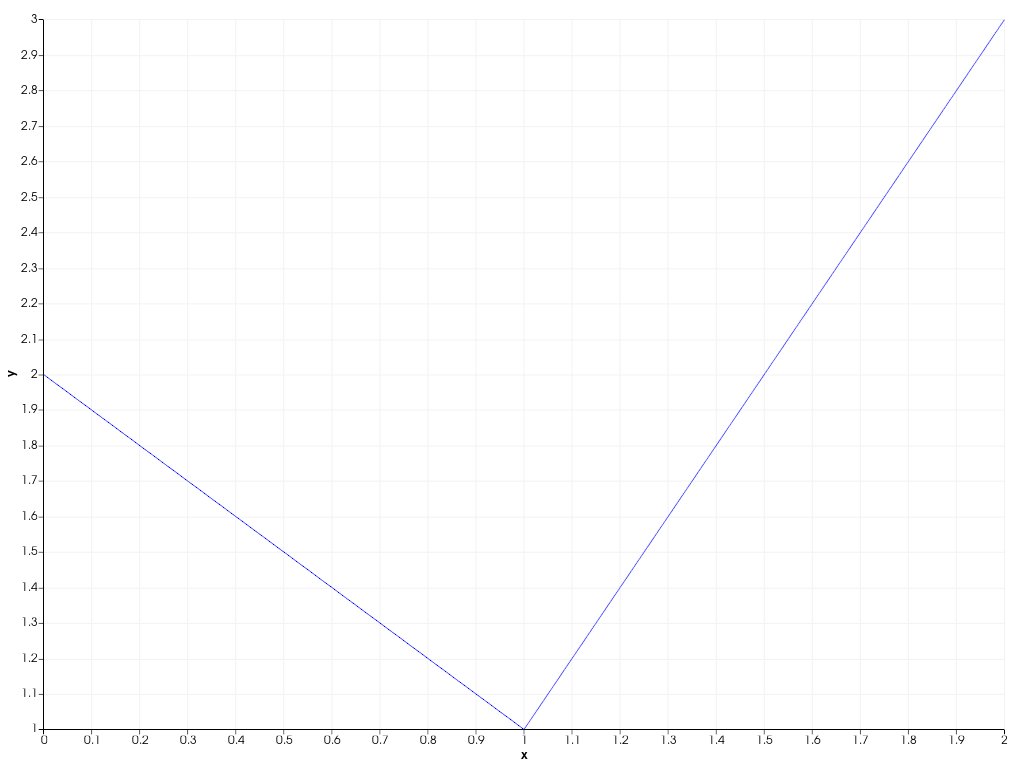
Revert back to automatic tick placement.
>>> chart.y_axis.tick_locations = None
>>> chart.y_axis.tick_labels = None
>>> chart.show()
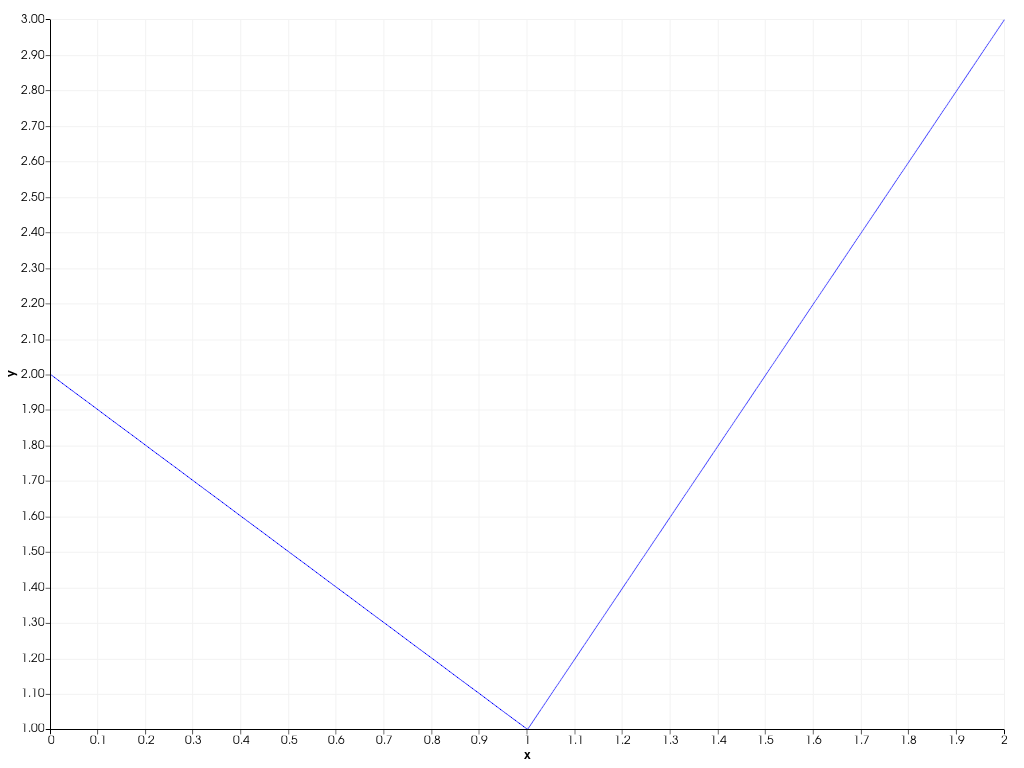
Specify a custom label format to use (fixed notation with precision 2).
>>> chart.y_axis.tick_labels = '2f'
>>> chart.show()