
Chart2D.hide_axes#
- Chart2D.hide_axes() None[source]#
Hide the x- and y-axis of this chart.
This includes all labels, ticks, and the grid.
Examples#
Download Python source code | Download Jupyter notebook
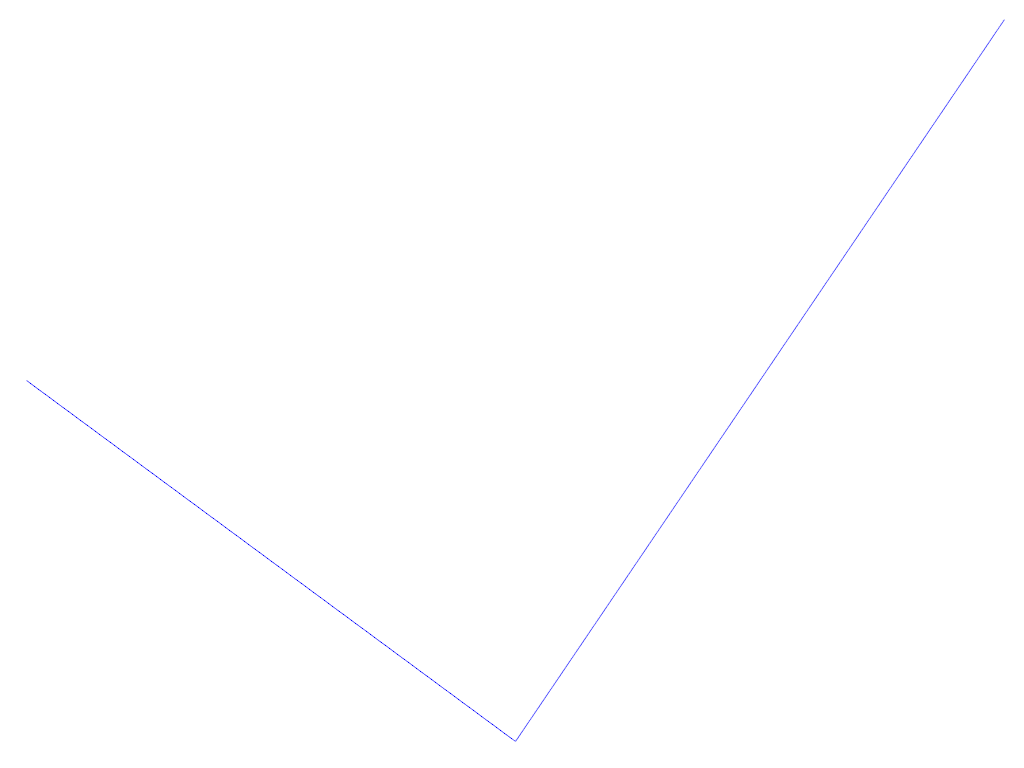
Create a 2D plot and hide the axes.
>>> import pyvista as pv
>>> chart = pv.Chart2D()
>>> _ = chart.line([0, 1, 2], [2, 1, 3])
>>> chart.hide_axes()
>>> chart.show()
Used In#
API Examples
LinePlot2D(1 use)
