
ChartMPL.border_width#
Examples#
Download Python source code | Download Jupyter notebook
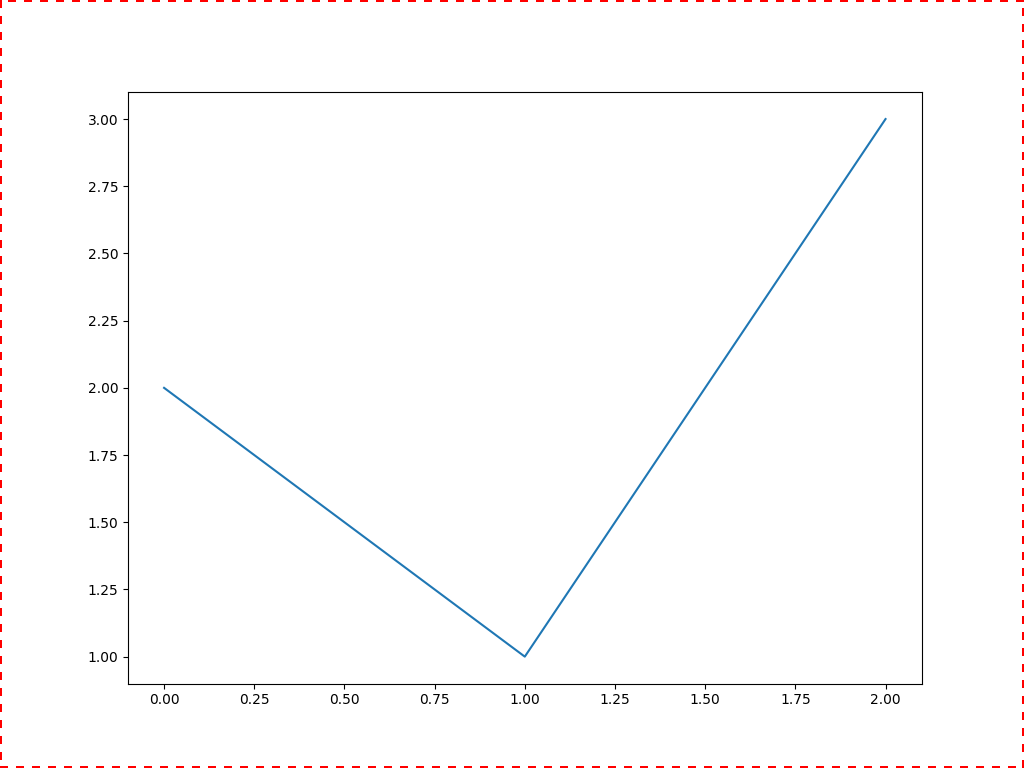
Create a matplotlib chart with a thick, dashed red border.
>>> import pyvista as pv
>>> chart = pv.ChartMPL()
        >>> plots = chart.figure.axes[0].plot([0, 1, 2], [2, 1, 3])
>>> chart.border_color = 'r'
>>> chart.border_width = 5
>>> chart.border_style = '--'
>>> chart.show(interactive=False)
Used In#
API Examples
ChartMPL.active_border_color(1 use)ChartMPL.border_color(1 use)ChartMPL.border_style(1 use)
