
LookupTable.plot#
- LookupTable.plot(**kwargs) None[source]#
Plot this lookup table.
- Parameters:
- **kwargs
dict, optional Optional keyword arguments passed to
pyvista.Plotter.show().
- **kwargs
Examples#
Download Python source code | Download Jupyter notebook
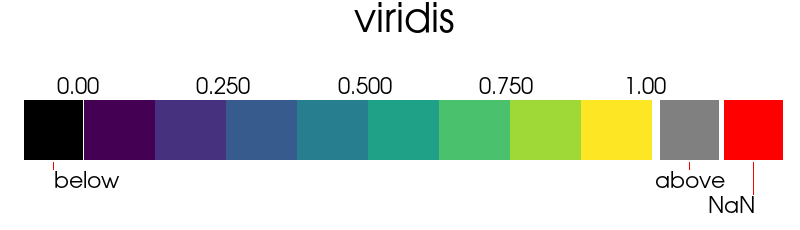
Plot the "viridis" colormap with the below and above colors.
>>> import pyvista as pv
>>> lut = pv.LookupTable('viridis', n_values=8)
>>> lut.below_range_color = 'black'
>>> lut.above_range_color = 'grey'
>>> lut.nan_color = 'r'
>>> lut.plot()
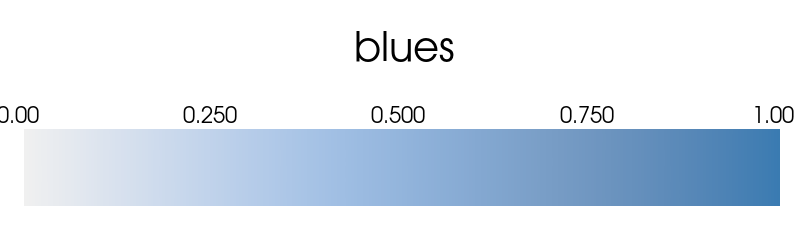
Plot only "blues" colormap.
>>> import pyvista as pv
>>> lut = pv.LookupTable('blues', n_values=1024)
>>> lut.plot()
Used In#
API Examples
LookupTable(1 use)LookupTable.above_range_color(1 use)LookupTable.above_range_opacity(1 use)LookupTable.alpha_range(1 use)LookupTable.annotations(1 use)13 more
LookupTable.apply_cmap(1 use)LookupTable.below_range_color(1 use)LookupTable.below_range_opacity(1 use)LookupTable.cmap(1 use)LookupTable.hue_range(1 use)LookupTable.log_scale(1 use)LookupTable.n_values(1 use)LookupTable.nan_color(1 use)LookupTable.nan_opacity(1 use)LookupTable.ramp(1 use)LookupTable.saturation_range(1 use)LookupTable.value_range(1 use)LookupTable.values(1 use)
Gallery Examples

