pyvista.plotting.charts.BoxPlot#
- class BoxPlot(*args, **kwargs)[source]#
Class representing a box plot.
Users should typically not directly create new plot instances, but use the dedicated
ChartBoxclass.- Parameters:
- chart
ChartBox The chart containing this plot.
- datasequence[array_like]
Dataset(s) from which the relevant statistics will be calculated used to draw the box plot.
- colorssequence[
ColorLike],optional Color of the boxes drawn in this plot. Any color parsable by
pyvista.Coloris allowed. If omitted (None), the default color scheme is used.- labelssequence[
str], default: [] Label for each box drawn in this plot, as shown in the chart’s legend.
- chart
Examples
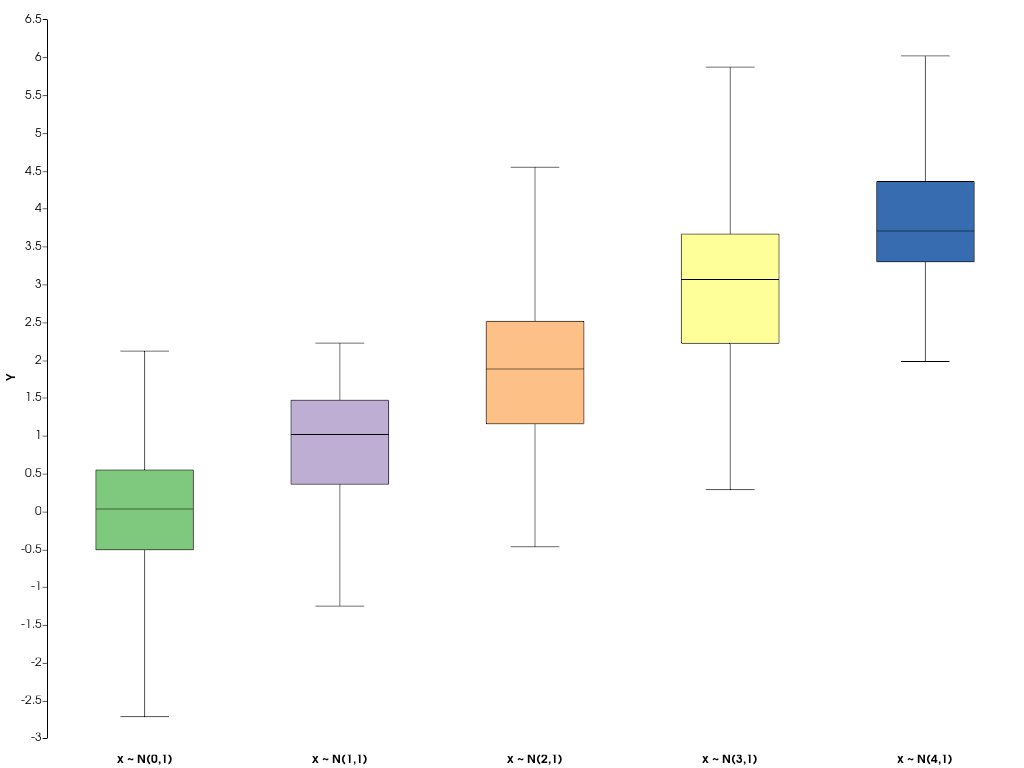
Create boxplots for datasets sampled from shifted normal distributions.
>>> import pyvista as pv
>>> import numpy as np
>>> rng = np.random.default_rng(
...     1
... )  # Seeded random number generator used for data generation
>>> normal_data = [rng.normal(i, size=50) for i in range(5)]
>>> chart = pv.ChartBox(
...     normal_data, labels=[f'x ~ N({i},1)' for i in range(5)]
... )
>>> chart.show()
Methods#
Toggle the plot's visibility. |
|
|
Update the plot's underlying dataset(s). |
Attributes#
Brush object controlling how shapes in this plot are filled. |
|
Return or set the plot's color. |
|
Return or set the plot's color scheme. |
|
Return or set the plot's colors. |
|
Retrieve the datasets of which the boxplots are drawn. |
|
Return or set the this plot's label, as shown in the chart's legend. |
|
Return or set the this plot's labels, as shown in the chart's legend. |
|
Return or set the line style of all lines drawn in this plot. |
|
Return or set the line width of all lines drawn in this plot. |
|
Pen object controlling how lines in this plot are drawn. |
|
Retrieve the statistics of the datasets of which the boxplots are drawn. |
|
Return or set the this plot's visibility. |