download_reservoir#
- download_reservoir(*, load: bool = True) ExplicitStructuredGrid | str[source]#
Download the UNISIM-II-D reservoir model.
UNISIM-II is a synthetic carbonate reservoir model created by UNISIM-CEPETRO-Unicamp. The dataset can be used to compare methodologies and performance of different techniques, simulators, algorithms, among others. See more at https://www.unisim.cepetro.unicamp.br/benchmarks/br/unisim-ii/overview
The simulation decks are licensed under the Open Database License (https://opendatacommons.org/licenses/odbl/1-0/) and their contents under the Database Contents License (https://opendatacommons.org/licenses/dbcl/1-0/).
- Parameters:
- Returns:
- output
pyvista.ExplicitStructuredGridorstr DataSet or filename depending on
load.
- output
Examples#
Download Python source code | Download Jupyter notebook
Load and plot dataset.
>>> from pyvista import examples
>>> import pyvista as pv
>>> dataset = examples.download_reservoir()
>>> dataset
ExplicitStructuredGrid (...)
  N Cells:      47610
  N Points:     58433
  X Bounds:     3.104e+05, 3.177e+05
  Y Bounds:     7.477e+06, 7.486e+06
  Z Bounds:     -2.472e+03, -1.577e+03
  Dimensions:   47, 70, 16
  N Arrays:     4
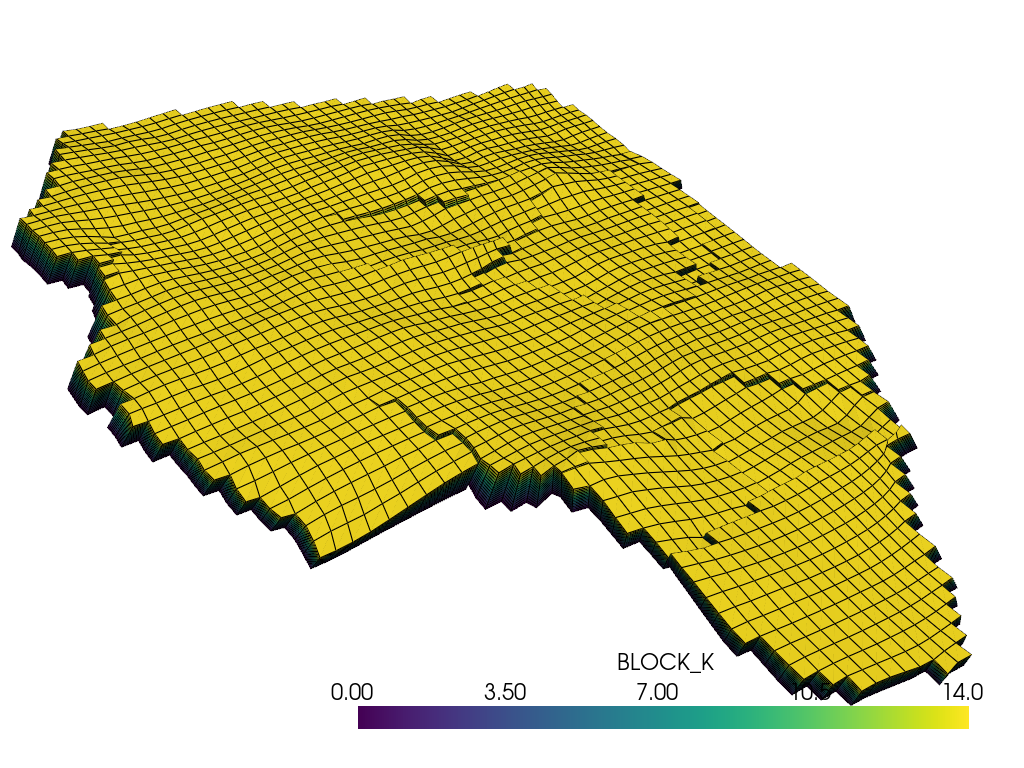
The 'BLOCK_I', 'BLOCK_J' and 'BLOCK_K' cell arrays are the structured
indices of each cell. Plot the grid colored by its layer index 'BLOCK_K'.
>>> pl = pv.Plotter()
>>> _ = pl.add_mesh(dataset, scalars='BLOCK_K', show_edges=True)
>>> camera = pl.camera
>>> camera.position = (312452, 7474760, 3507)
>>> camera.focal_point = (314388, 7481520, -2287)
>>> camera.up = (0.09, 0.63, 0.77)
>>> camera.distance = 9112
>>> camera.clipping_range = (595, 19595)
>>> pl.show()
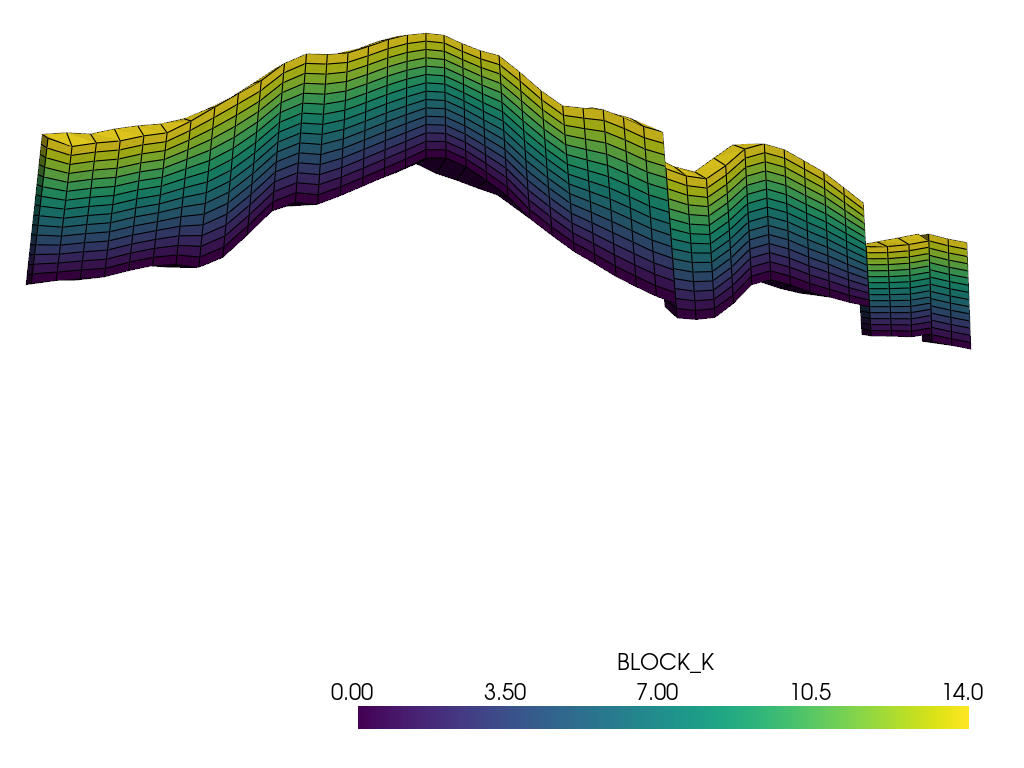
Show the layers in a cross-section, with the elevation exaggerated.
>>> section = dataset.extract_cells(dataset.cell_data['BLOCK_J'] == 34)
>>> pl = pv.Plotter()
>>> _ = pl.add_mesh(section, scalars='BLOCK_K', show_edges=True)
>>> pl.set_scale(zscale=5)
>>> pl.view_xz()
>>> pl.camera.zoom(2)
>>> pl.show()
See Also#
- Reservoir Dataset
See this dataset in the Dataset Gallery for more info.