Note
Go to the end to download the full example code.
Label Points#
Use string arrays in a point set to label points
from __future__ import annotations

import numpy as np

import pyvista as pv


from pyvista import examples
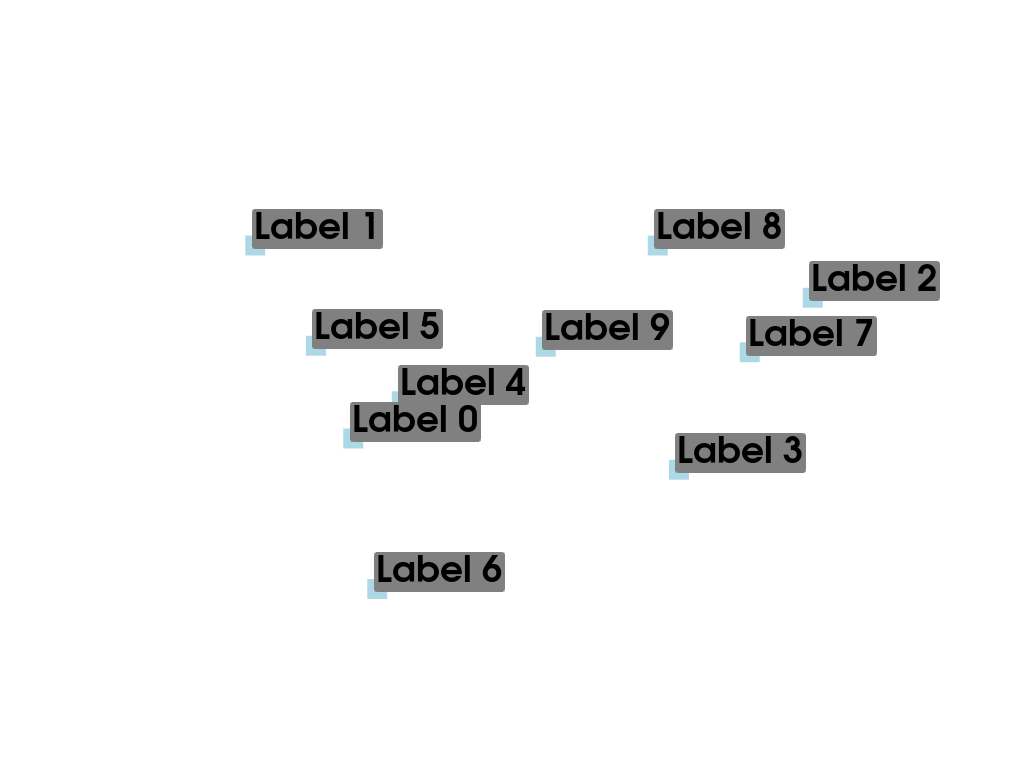
Label String Array#
This example will label the nodes of a mesh with a given array of string labels for each of the nodes.
# Make some random points. Seed the rng for reproducibility.
rng = np.random.default_rng(seed=0)
poly = pv.PolyData(rng.random((10, 3)))
Add string labels to the point data - this associates a label with every node:
poly['My Labels'] = [f'Label {i}' for i in range(poly.n_points)]
poly
Now plot the points with labels using add_point_labels().
plotter = pv.Plotter()
plotter.add_point_labels(poly, 'My Labels', point_size=20, font_size=36)
plotter.show()
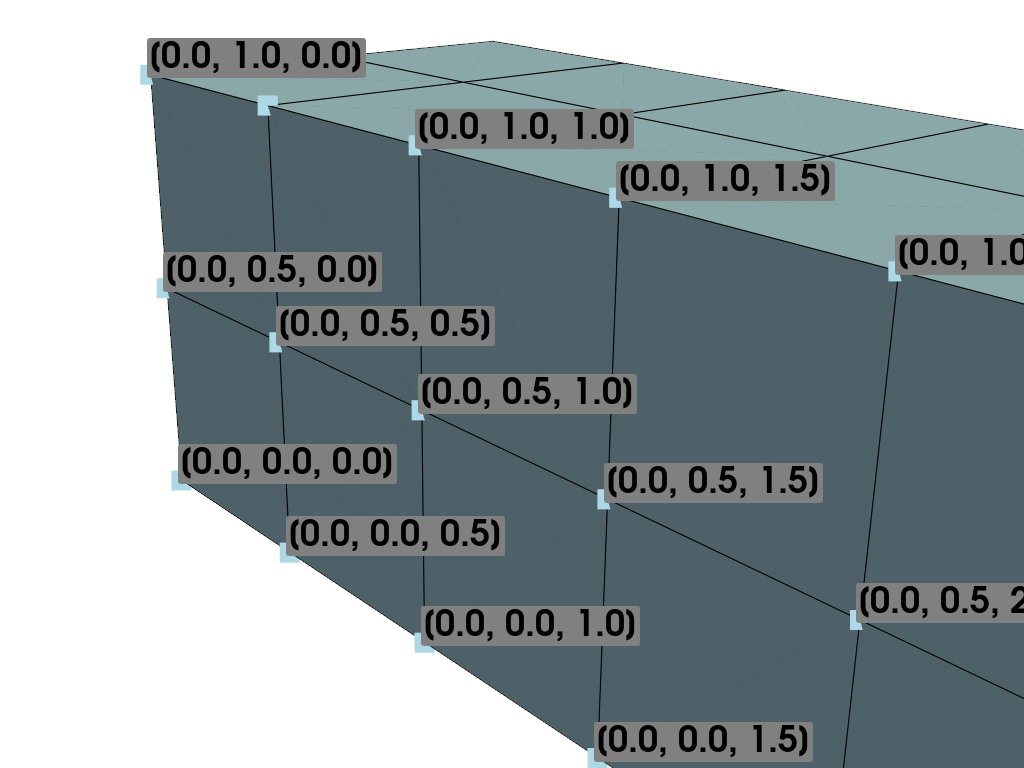
Label Node Locations#
This example will label the nodes of a mesh with their coordinate locations
# Load example beam file
grid = pv.UnstructuredGrid(examples.hexbeamfile)
Create plotting class and add the unstructured grid
plotter = pv.Plotter()
plotter.add_mesh(grid, show_edges=True, color='lightblue')

# Add labels to points on the yz plane (where x == 0)
points = grid.points
mask = points[:, 0] == 0
plotter.add_point_labels(points[mask], points[mask].tolist(), point_size=20, font_size=36)

plotter.camera_position = [(-1.5, 1.5, 3.0), (0.05, 0.6, 1.2), (0.2, 0.9, -0.25)]

plotter.show()
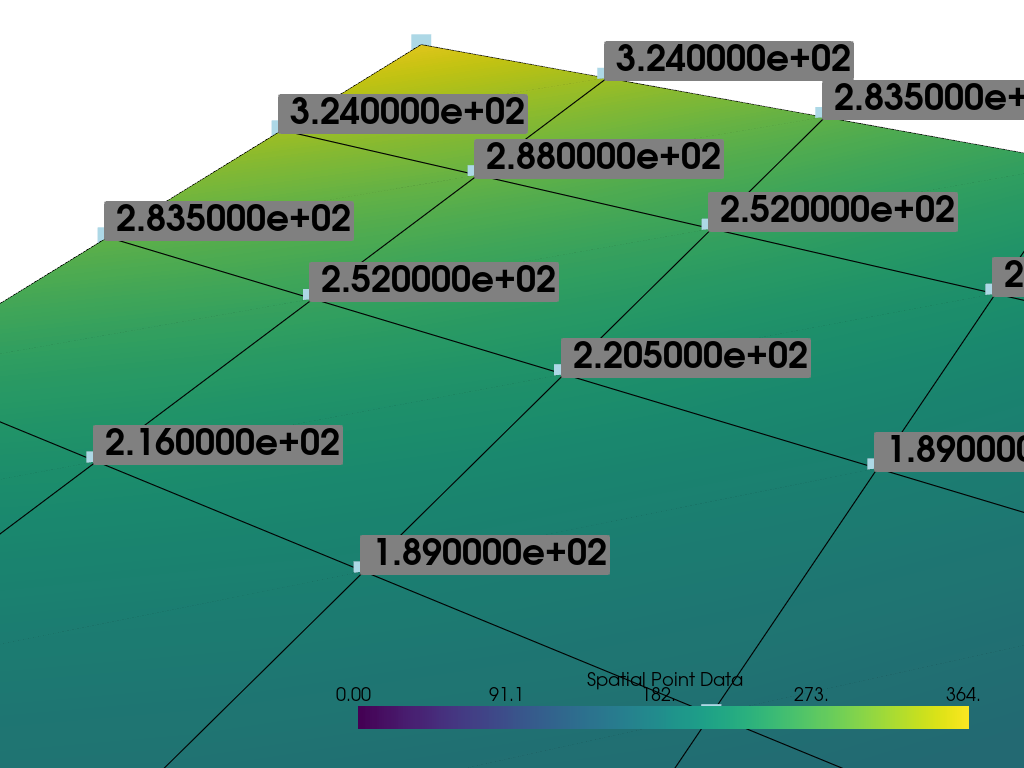
Label Scalar Values#
This example will label each point with their scalar values
mesh = examples.load_uniform().slice()
p = pv.Plotter()

# Add the mesh:
p.add_mesh(mesh, scalars='Spatial Point Data', show_edges=True)
# Add the points with scalar labels:
p.add_point_scalar_labels(mesh, 'Spatial Point Data', point_size=20, font_size=36)

# Use a nice camera position:
p.camera_position = [(7, 4, 5), (4.4, 7.0, 7.2), (0.8, 0.5, 0.25)]

p.show()
Total running time of the script: (0 minutes 0.763 seconds)