
Plot Truss-Like FEA Solution With Cylinders#
Download Python source code | Download Jupyter notebook
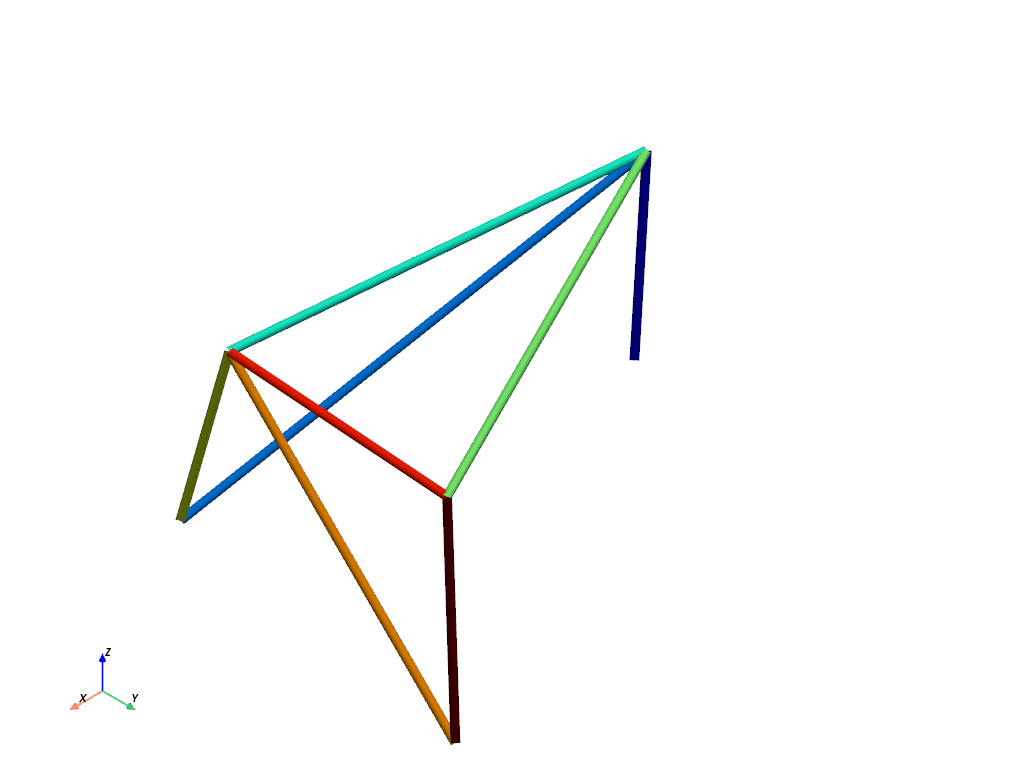
Plot connections between points in 3D as cylinders, colored by scalars.
Lines are created in a pyvista.PolyData and then rendered as
cylinders.
import numpy as np
import pyvista as pv
Define the points and elements of the truss. Call them nodes
here as it comes from finite element analysis.
nodes = [
    [0.0, 0.0, 0.0],
    [0.0, 1.0, 0.0],
    [4.0, 3.0, 0.0],
    [4.0, 0.0, 0.0],
    [0.0, 1.0, 2.0],
    [4.0, 1.0, 2.0],
    [4.0, 3.0, 2.0],
]


edges = np.array(
    [
        [0, 4],
        [1, 4],
        [3, 4],
        [5, 4],
        [6, 4],
        [3, 5],
        [2, 5],
        [5, 6],
        [2, 6],
    ],
)

# We must "pad" the edges to indicate to vtk how many points per edge
padding = np.empty(edges.shape[0], int) * 2
padding[:] = 2
edges_w_padding = np.vstack((padding, edges.T)).T
edges_w_padding
array([[2, 0, 4],
       [2, 1, 4],
       [2, 3, 4],
       [2, 5, 4],
       [2, 6, 4],
       [2, 3, 5],
       [2, 2, 5],
       [2, 5, 6],
       [2, 2, 6]])
Plot the truss while rendering the lines as tubes.
mesh = pv.PolyData(nodes, edges_w_padding)

colors = range(edges.shape[0])
mesh.plot(
    scalars=colors,
    render_lines_as_tubes=True,
    style='wireframe',
    line_width=10,
    cmap='jet',
    show_scalar_bar=False,
    background='w',
)
Total running time of the script: (0 minutes 0.276 seconds)
