pyvista.UnstructuredGridFilters.delaunay_2d#
- UnstructuredGridFilters.delaunay_2d(tol=1e-05, alpha=0.0, offset=1.0, bound=False, inplace=False, edge_source=None, progress_bar=False)[source]#
Apply a 2D Delaunay filter along the best fitting plane.
This filter can be used to generate a 2d surface from a set of points on a plane. If you want to create a surface from a point cloud, see
pyvista.PolyDataFilters.reconstruct_surface().- Parameters:
- tol
float, default: 1e-05 Specify a tolerance to control discarding of closely spaced points. This tolerance is specified as a fraction of the diagonal length of the bounding box of the points.
- alpha
float, default: 0.0 Specify alpha (or distance) value to control output of this filter. For a non-zero alpha value, only edges or triangles contained within a sphere centered at mesh vertices will be output. Otherwise, only triangles will be output.
- offset
float, default: 1.0 Specify a multiplier to control the size of the initial, bounding Delaunay triangulation.
- boundbool, default:
False Boolean controls whether bounding triangulation points and associated triangles are included in the output. These are introduced as an initial triangulation to begin the triangulation process. This feature is nice for debugging output.
- inplacebool, default:
False If
True, overwrite this mesh with the triangulated mesh.- edge_source
pyvista.PolyData,optional Specify the source object used to specify constrained edges and loops. If set, and lines/polygons are defined, a constrained triangulation is created. The lines/polygons are assumed to reference points in the input point set (i.e. point ids are identical in the input and source).
- progress_barbool, default:
False Display a progress bar to indicate progress.
- tol
- Returns:
pyvista.PolyDataMesh from the 2D delaunay filter.
Examples
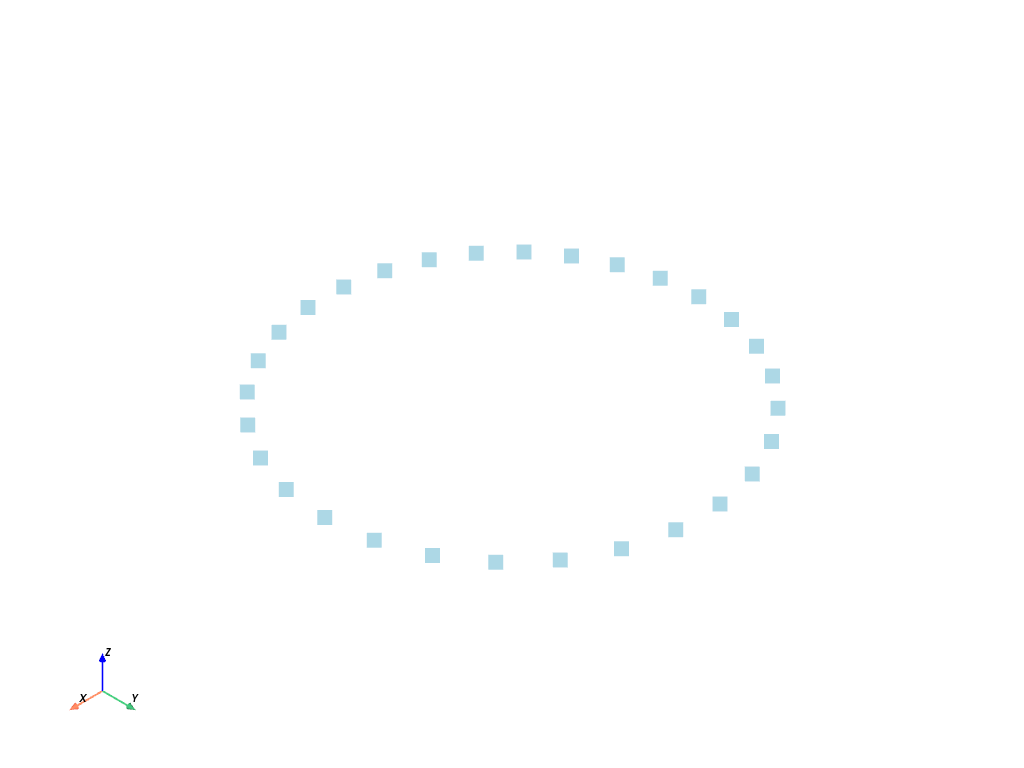
First, generate 30 points on circle and plot them.
>>> import pyvista as pv
>>> points = pv.Polygon(n_sides=30).points
>>> circle = pv.PolyData(points)
>>> circle.plot(show_edges=True, point_size=15)
Use
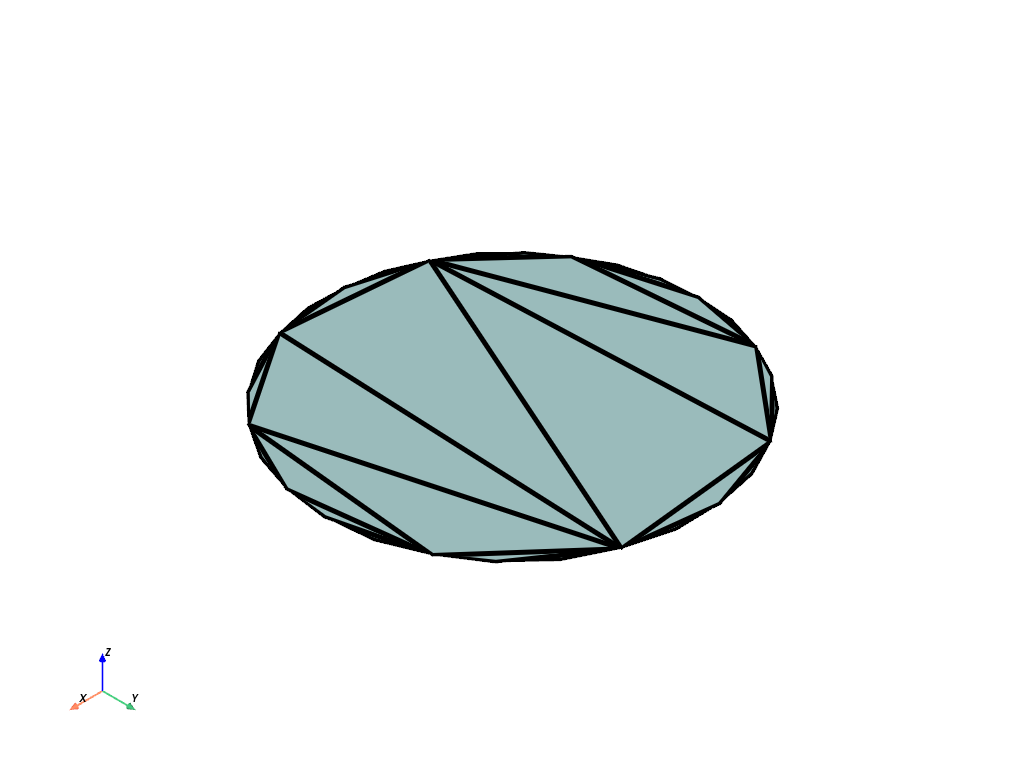
delaunay_2d()to fill the interior of the circle.>>> filled_circle = circle.delaunay_2d() >>> filled_circle.plot(show_edges=True, line_width=5)
Use the
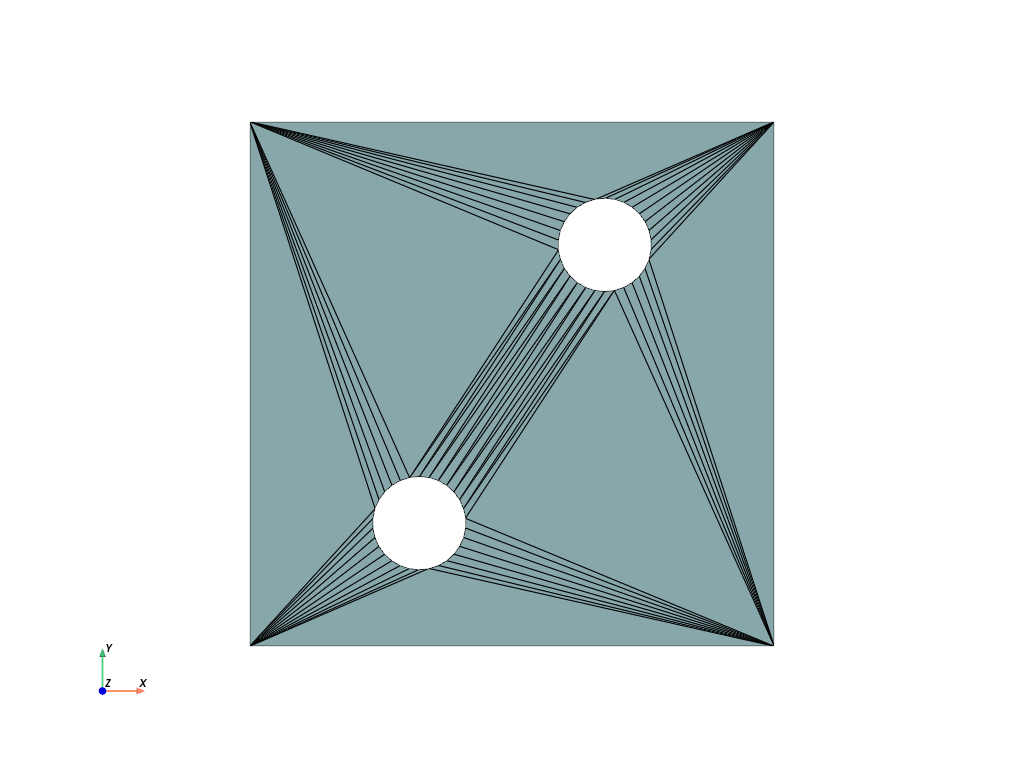
edge_sourceparameter to create a constrained delaunay triangulation and plot it.>>> squar = pv.Polygon(n_sides=4, radius=8, fill=False) >>> squar = squar.rotate_z(45, inplace=False) >>> circ0 = pv.Polygon(center=(2, 3, 0), n_sides=30, radius=1) >>> circ1 = pv.Polygon(center=(-2, -3, 0), n_sides=30, radius=1) >>> comb = circ0 + circ1 + squar >>> tess = comb.delaunay_2d(edge_source=comb) >>> tess.plot(cpos='xy', show_edges=True)
See Create Triangulated Surface for more examples using this filter.