pyvista.PolyDataFilters.ribbon#
- PolyDataFilters.ribbon(width=None, scalars=None, angle=0.0, factor=2.0, normal=None, tcoords=False, preference='points', progress_bar=False)[source]#
Create a ribbon of the lines in this dataset.
Note
If there are no lines in the input dataset, then the output will be an empty
pyvista.PolyDatamesh.- Parameters:
- width
float,optional Set the “half” width of the ribbon. If the width is allowed to vary, this is the minimum width. The default is 10% the length.
- scalars
str,optional String name of the scalars array to use to vary the ribbon width. This is only used if a scalars array is specified.
- angle
float,optional Angle in degrees of the offset angle of the ribbon from the line normal. The default is 0.0.
- factor
float,optional Set the maximum ribbon width in terms of a multiple of the minimum width. The default is 2.0.
- normalsequence[
float],optional Normal to use as default.
- tcoordsbool,
str,optional If
True, generate texture coordinates along the ribbon. This can also be specified to generate the texture coordinates with either'length'or'normalized'.- preference
str,optional The field preference when searching for the scalars array by name.
- progress_barbool, default:
False Display a progress bar to indicate progress.
- width
- Returns:
pyvista.PolyDataRibbon mesh. Empty if there are no lines in the input dataset.
Examples
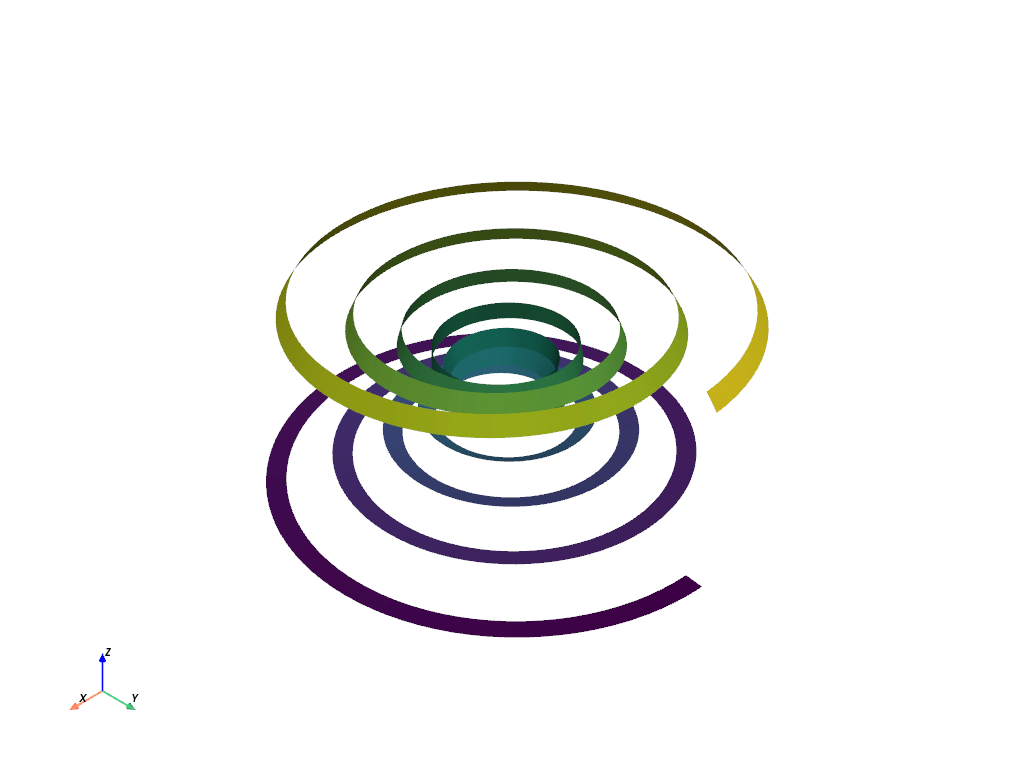
Convert a line to a ribbon and plot it.
>>> import numpy as np
>>> import pyvista as pv
>>> n = 1000
>>> theta = np.linspace(-10 * np.pi, 10 * np.pi, n)
>>> z = np.linspace(-2, 2, n)
>>> r = z**2 + 1
>>> x = r * np.sin(theta)
>>> y = r * np.cos(theta)
>>> points = np.column_stack((x, y, z))
>>> pdata = pv.PolyData(points)
>>> pdata.lines = np.hstack((n, range(n)))
>>> pdata['distance'] = range(n)
>>> ribbon = pdata.ribbon(width=0.2)
>>> ribbon.plot(show_scalar_bar=False)