pyvista.DataSetFilters.point_data_to_cell_data#
- DataSetFilters.point_data_to_cell_data(pass_point_data=False, progress_bar=False)[source]#
Transform point data into cell data.
Point data are specified per node and cell data specified within cells. Optionally, the input point data can be passed through to the output.
See also:
pyvista.DataSetFilters.cell_data_to_point_data()- Parameters:
- Returns:
pyvista.DataSetDataset with the point data transformed into cell data. Return type matches input.
Examples
Color cells by their z coordinates. First, create point scalars based on z-coordinates of a sample sphere mesh. Then convert this point data to cell data. Use a low resolution sphere for emphasis of cell valued data.
First, plot these values as point values to show the difference between point and cell data.
>>> import pyvista as pv
>>> sphere = pv.Sphere(theta_resolution=10, phi_resolution=10)
>>> sphere['Z Coordinates'] = sphere.points[:, 2]
>>> sphere.plot()

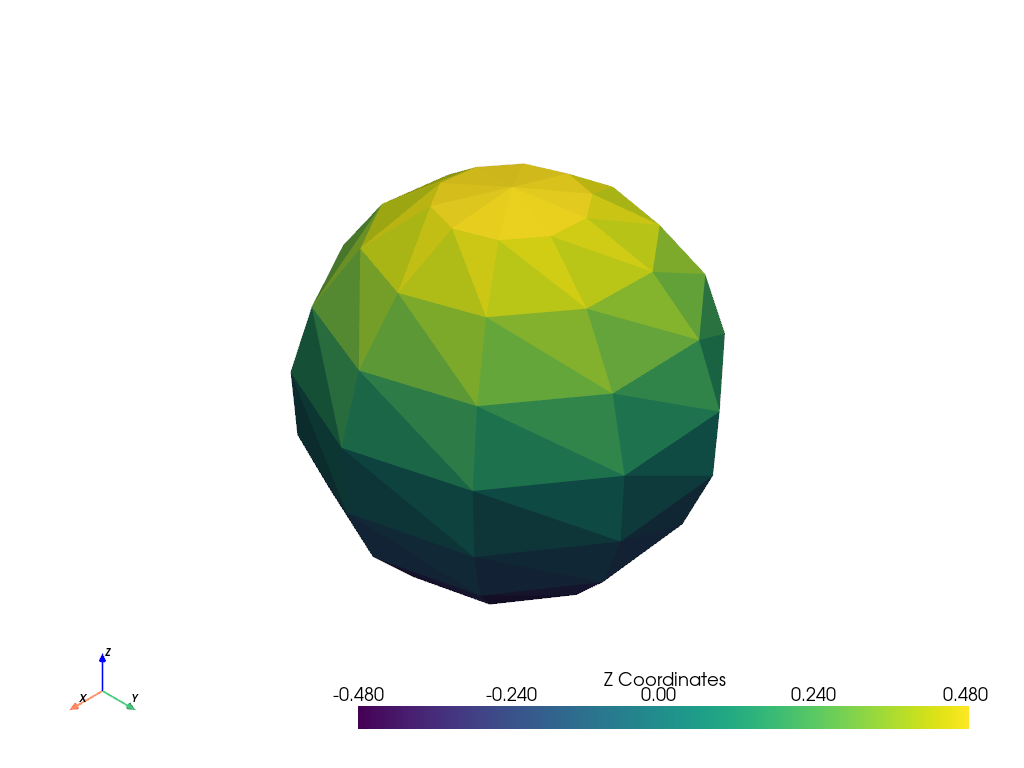
Now, convert these values to cell data and then plot it.
>>> import pyvista as pv
>>> sphere = pv.Sphere(theta_resolution=10, phi_resolution=10)
>>> sphere['Z Coordinates'] = sphere.points[:, 2]
>>> sphere = sphere.point_data_to_cell_data()
>>> sphere.plot()