pyvista.DataSetFilters.elevation#
- DataSetFilters.elevation(
- low_point=None,
- high_point=None,
- scalar_range=None,
- preference='point',
- set_active: bool = True,
- progress_bar: bool = False,
Generate scalar values on a dataset.
The scalar values lie within a user specified range, and are generated by computing a projection of each dataset point onto a line. The line can be oriented arbitrarily. A typical example is to generate scalars based on elevation or height above a plane.
Warning
This will create a scalars array named
'Elevation'on the point data of the input dataset and overwrite the array named'Elevation'if present.- Parameters:
- low_pointsequence[
float],optional The low point of the projection line in 3D space. Default is bottom center of the dataset. Otherwise pass a length 3 sequence.
- high_pointsequence[
float],optional The high point of the projection line in 3D space. Default is top center of the dataset. Otherwise pass a length 3 sequence.
- scalar_range
str| sequence[float],optional The scalar range to project to the low and high points on the line that will be mapped to the dataset. If None given, the values will be computed from the elevation (Z component) range between the high and low points. Min and max of a range can be given as a length 2 sequence. If
str, name of scalar array present in the dataset given, the valid range of that array will be used.- preference
str, default: “point” When an array name is specified for
scalar_range, this is the preferred array type to search for in the dataset. Must be either'point'or'cell'.- set_activebool, default:
True A boolean flag on whether or not to set the new
'Elevation'scalar as the active scalars array on the output dataset.- progress_barbool, default:
False Display a progress bar to indicate progress.
- low_pointsequence[
- Returns:
pyvista.DataSetDataset containing elevation scalars in the
"Elevation"array inpoint_data.
Examples
Generate the “elevation” scalars for a sphere mesh. This is simply the height in Z from the XY plane.
>>> import pyvista as pv
>>> sphere = pv.Sphere()
>>> sphere_elv = sphere.elevation()
>>> sphere_elv.plot(smooth_shading=True)
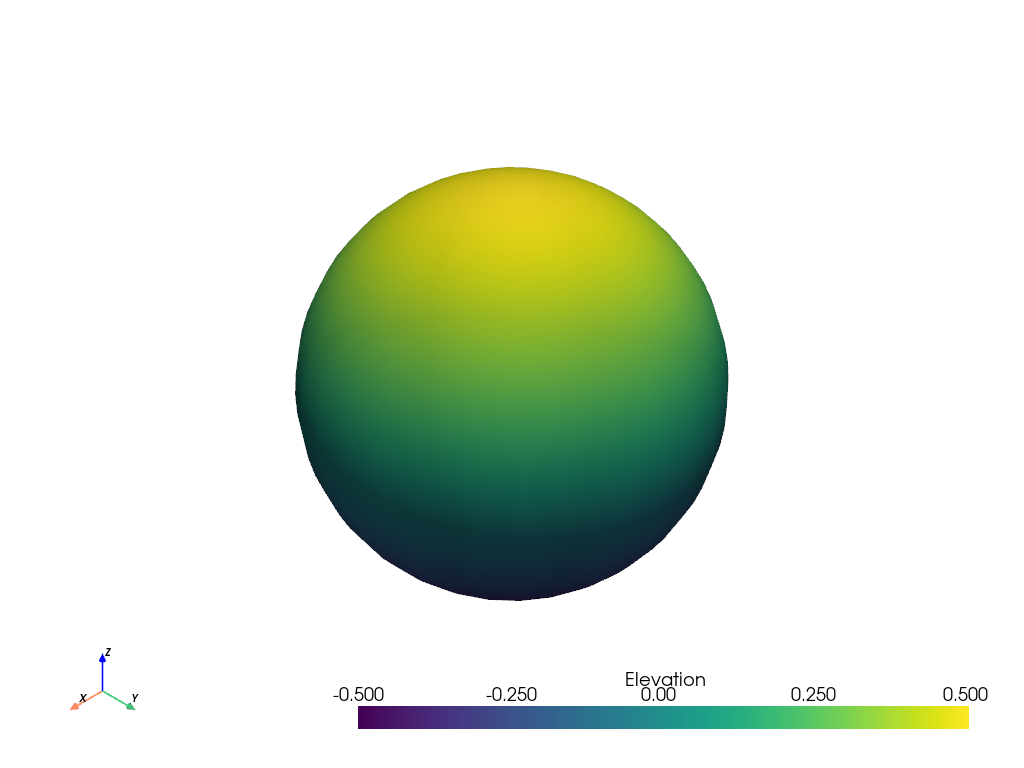
Access the first 4 elevation scalars. This is a point-wise array containing the “elevation” of each point.
>>> sphere_elv['Elevation'][:4]
array([-0.5       ,  0.5       , -0.49706897, -0.48831028], dtype=float32)
See Using Common Filters for more examples using this filter.