pyvista.DataSetFilters.compute_derivative#
- DataSetFilters.compute_derivative(scalars=None, gradient=True, divergence=None, vorticity=None, qcriterion=None, faster=False, preference='point', progress_bar=False)[source]#
Compute derivative-based quantities of point/cell scalar field.
Utilize
vtkGradientFilterto compute derivative-based quantities, such as gradient, divergence, vorticity, and Q-criterion, of the selected point or cell scalar field.- Parameters:
- scalars
str,optional String name of the scalars array to use when computing the derivative quantities. Defaults to the active scalars in the dataset.
- gradientbool |
str, default:True Calculate gradient. If a string is passed, the string will be used for the resulting array name. Otherwise, array name will be
'gradient'. DefaultTrue.- divergencebool |
str,optional Calculate divergence. If a string is passed, the string will be used for the resulting array name. Otherwise, default array name will be
'divergence'.- vorticitybool |
str,optional Calculate vorticity. If a string is passed, the string will be used for the resulting array name. Otherwise, default array name will be
'vorticity'.- qcriterionbool |
str,optional Calculate qcriterion. If a string is passed, the string will be used for the resulting array name. Otherwise, default array name will be
'qcriterion'.- fasterbool, default:
False Use faster algorithm for computing derivative quantities. Result is less accurate and performs fewer derivative calculations, increasing computation speed. The error will feature smoothing of the output and possibly errors at boundaries. Option has no effect if DataSet is not
pyvista.UnstructuredGrid.- preference
str, default: “point” Data type preference. Either
'point'or'cell'.- progress_barbool, default:
False Display a progress bar to indicate progress.
- scalars
- Returns:
pyvista.DataSetDataset with calculated derivative.
Examples
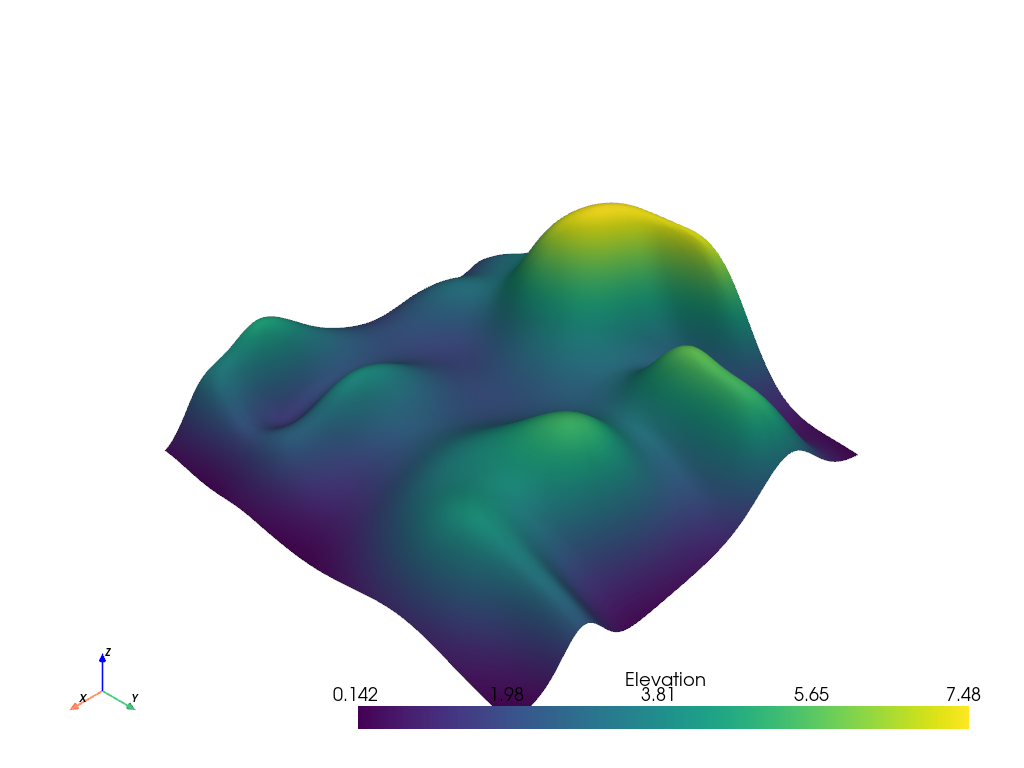
First, plot the random hills dataset with the active elevation scalars. These scalars will be used for the derivative calculations.
>>> from pyvista import examples
>>> hills = examples.load_random_hills()
>>> hills.plot(smooth_shading=True)
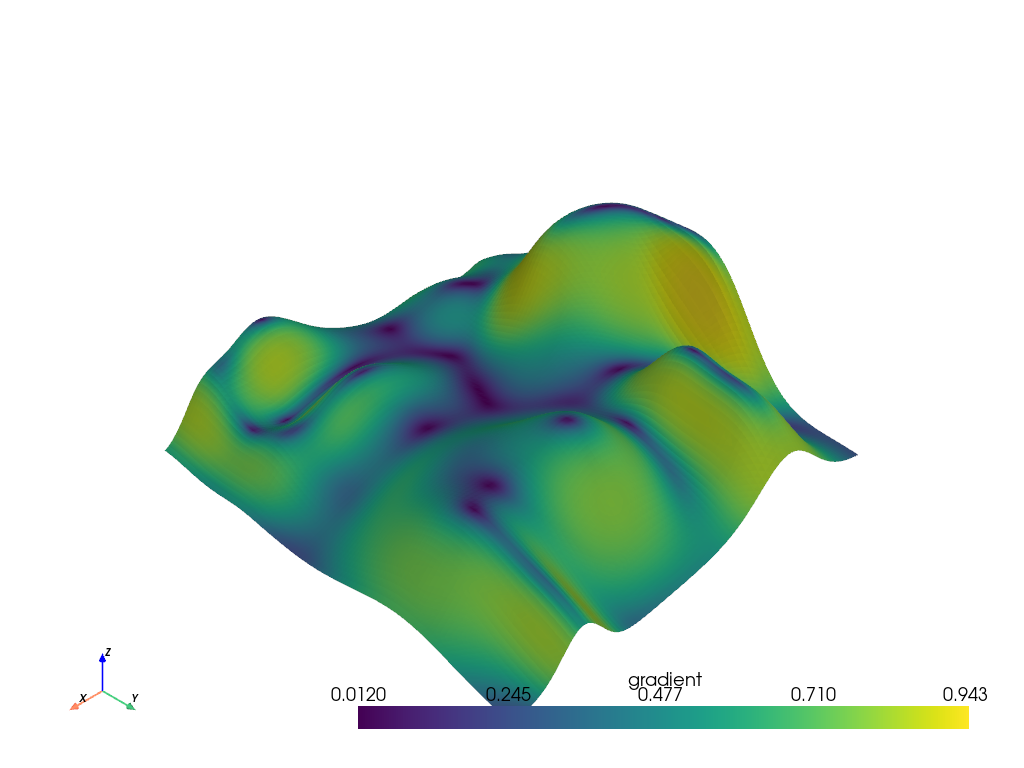
Compute and plot the gradient of the active scalars.
>>> from pyvista import examples
>>> hills = examples.load_random_hills()
>>> deriv = hills.compute_derivative()
>>> deriv.plot(scalars='gradient')
See the Compute Gradients of a Field for more examples using this filter.